Project Background
In recent years, the consumption of maternal and infant products has gradually increased. This is a sales data of maternal and infant products on Taobao and Tmall (2012/July to 2015/February). Analyzing this data set is helpful to understand the current market sales, facilitate operational decisions and increase sales.
The data set comes from Tianchi: https://tianchi.aliyun.com/dataset/dataDetail?dataId=45 The
data set includes two tables:
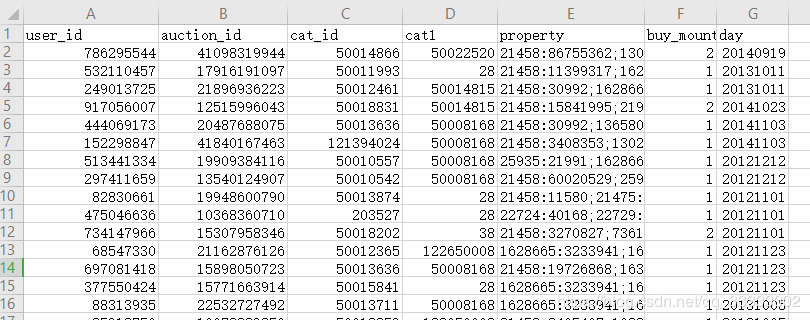
(sample)
Interpretation of sam_tianchi_mum_baby_trade_history.csv data: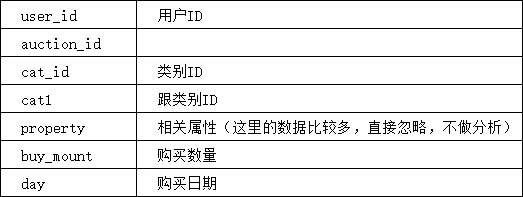
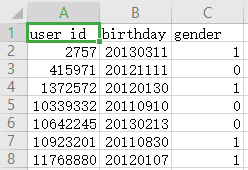
(sample)
Interpretation of sam_tianchi_mum_baby.csv data: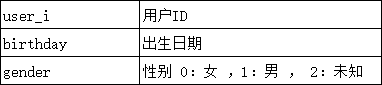
2. Definition of age group of users of maternal and infant products
Infancy: refers to the first year after a child is born.
Early childhood: the second and third year after birth (2-3 years old)
Early childhood: refers to the age group from three to six or seven years old. According to the age group of each kindergarten class, it can be divided into small class: 3-4 years old, middle class: 4-5 years old, and big class 5-7 years old.
School age: refers to the age group from six to seven years old to fifteen years old. For the convenience of stratification, it is directly defined to eight to fifteen years old.
(Source from Baidu Library)
3. Analysis framework
Four, analysis + visualization
4.1 Overall situation
4.2 Sales indicators
1 Annual sales volume and order volume situation
Since the data is the sales data from July 2012 to February 2015, here is the analysis of the annual summary sales data for 2012 and 2015, there will be some deviations, here only the analysis of 2013 and 2014.
Conclusion 1: The sales volume in 2014 was 23,841, an increase of 50.9% from the previous year.
Conclusion 2: The number of orders in 2014 was 15 003, an increase of 54.1% from the previous year.
2 Quarterly sales volume, order volume situation and forecast value
Conclusion: There is a gradual increase in sales volume and order volume.
It is predicted that the sales volume in the first quarter of 2015 will reach about 6,400 and the order volume will reach about 3,800.
3 Monthly sales
 4 Monthly order volume situation
Combining 4.2.3 and 4.2.4 analysis:
Conclusion 1: Vertical comparison of the sales volume and order volume data from July to December 2012-2015 shows that the annual sales volume and order volume have a gradual increase trend.
Conclusion 2: May and November reach small peaks, which are peak months for sales.
Conclusion 3: The fourth quarter has more sales and orders than other quarters. The fourth quarter is the peak season for maternal and child products.
Conclusion 4: The sales volume in the second half of the year is better than the first half, and the order volume in the second half of the year is more than that in the first half.
Drill down for the problem of Conclusion 2:
Check the daily sales quantity and order quantity in May and November of each year, and check the specific day that caused the increase in sales quantity and order quantity in that month.
First analyze the May:
Conclusion 5: The order volume in April, May, and June is relatively stable. The sales volume in May is relatively volatile compared to April and June, so it is a small peak in the sales volume in the middle of the month, leading to an increase in the overall sales volume in May.
Analysis of November:
Conclusion 6: The number of orders and sales on Double 11 reached the peak, which is the reason for the increase in the number of orders and sales in that month compared to October and December. It means that users will buy maternal and infant products on Double 11.
Conclusion 7: The number of orders and sales on Double 12 also reached a small peak. The sales value of Double 12 is also not to be missed. Corresponding discounts and promotions must be done to increase sales and achieve the purpose of increasing profits.
4.3 Analysis of product sales
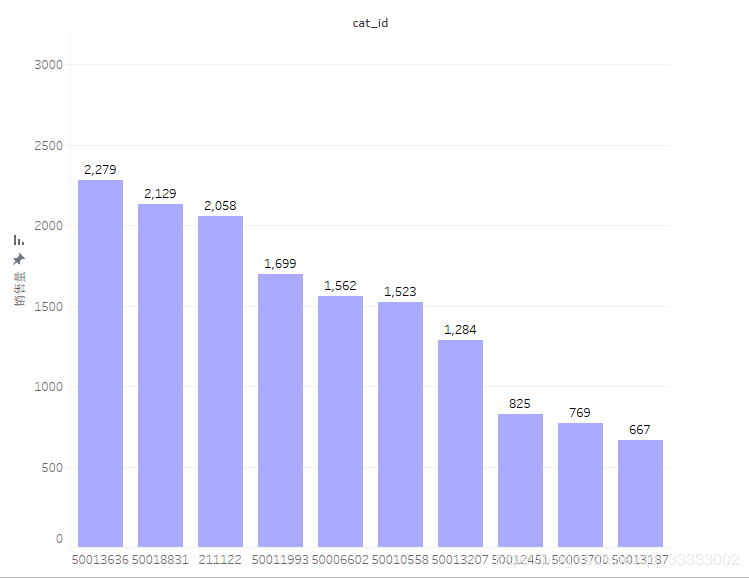
1 The top 10 commodity categories and proportions in sales volume, and the top 30 commodities accounted for
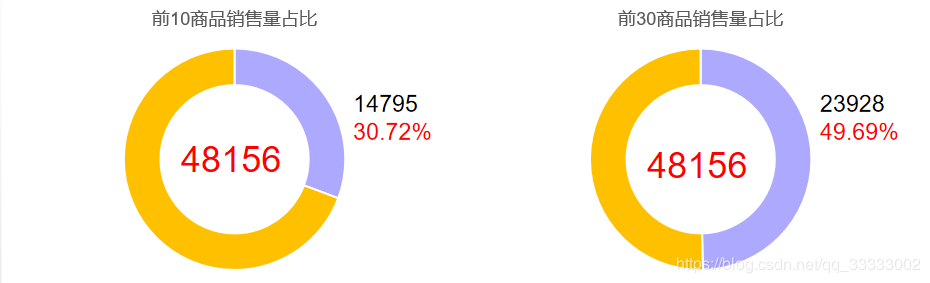
Conclusion 1: Top 10: category products accounted for 1.5% of the total category ID; sales: 14,795, accounting for 30.72% of the total sales.
Conclusion 2: The top 30 categories of goods accounted for 4.5% of the total category ID; sales volume: 23928, accounting for 49.69% of the total sales volume.
Suggestion: The top 30 category ID products should be the key products for sale, to further exert the head effect and increase the total sales volume. In addition, some of the products at the end provide less value, and you can consider removing these products from the shelves.
2 Sales volume of products and categories
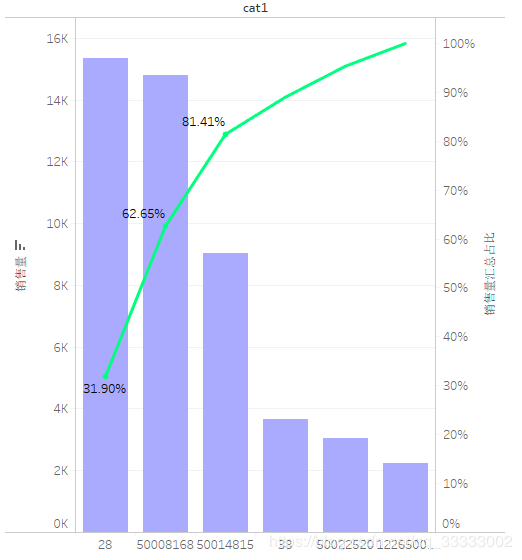
Conclusion 1: The sales volume with category 28 is 15,360, accounting for 31.90% of total sales, followed by 50008168, 50008168 and 28 together account for 62.65% of total sales. The sales volume of the top three categories accounted for 81.41% of the total sales volume. The e-commerce platform should mainly promote these three categories of goods to increase sales.
It is recommended that you can reduce the inventory of the last three categories of goods or cut down some less profitable products to reduce costs.
4.4 User analysis
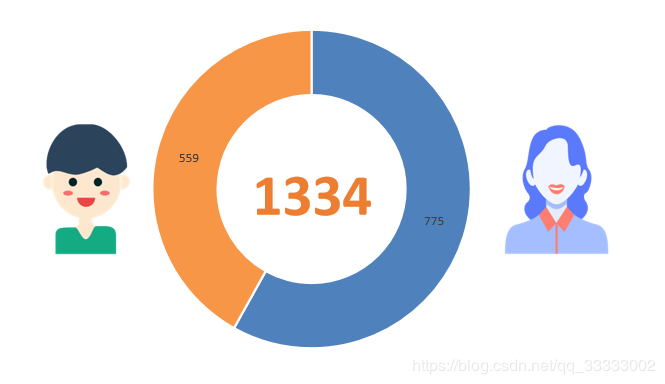
1 Gender distribution
Conclusion 1: The ratio of men to women is balanced.
2 Sales volume by gender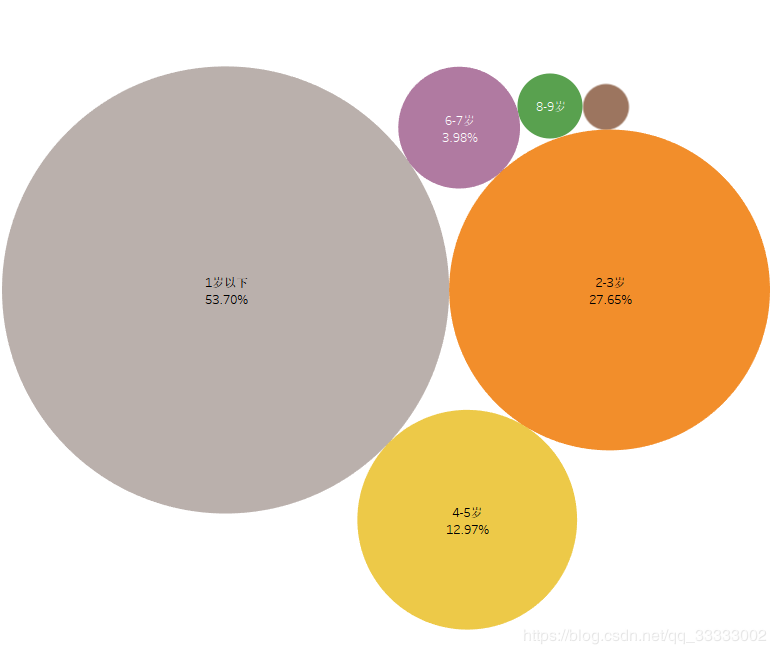
Conclusion 2: Girls have more sales than boys, and girls have relatively higher purchasing needs.
3 Distribution of people by age group
Conclusion 3: The main consumer group of maternal and infant products on this platform is children around 1 year old, accounting for 53.70%; followed by children aged 2-3, accounting for 27.65%. This shows that 80% of the platform's customers are children aged 1-3.
4 Sales volume by age group
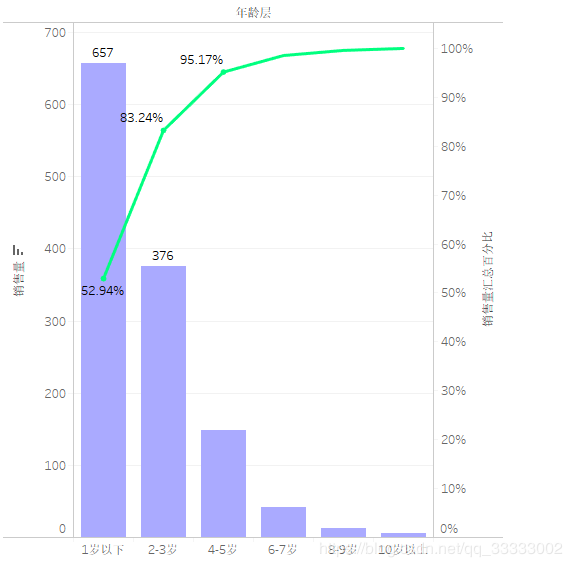
Conclusion: The sales volume of children under 1 is the lowest at 657, accounting for 52.94%; the sales volume of the 1-3 year-old age group has reached 83.24%. The platform can mainly promote maternal and child products of this age group to meet 80% of customer needs.