 1 #!/usr/bin/env python3
 2 #-*- coding:utf-8 -*-
 3 ############################
 4 #File Name: test.py
 5 #Author: frank
 6 #Mail: [email protected]
 7 #Created Time:2018-05-23 00:01:30
 8 ############################
 9
10 import numpy as np
11 import matplotlib.pyplot as plt
12 import matplotlib as mpl
13
14 zhfont = mpl.font_manager.FontProperties(fname='/usr/share/fonts/truetype/wqy/wqy-microhei.ttc')
15
16 radar_labels = np.array(['研究型(I)','艺术型(A)','社会型(S)', '企业型(E)','常规型(C)','现实型(R)']) #雷达标签,极角标签
17
18
19 nAttr = 6
20
21 data = np.array([[0.40, 0.32, 0.35, 0.30, 0.30, 0.88],
22     ¦   ¦   ¦   ¦[0.85, 0.35, 0.30, 0.40, 0.40, 0.30],
23     ¦   ¦   ¦   ¦[0.43, 0.89, 0.30, 0.28, 0.22, 0.30],
24     ¦   ¦   ¦   ¦[0.30, 0.25, 0.48, 0.85, 0.45, 0.40],
25     ¦   ¦   ¦   ¦[0.20, 0.38, 0.87, 0.45, 0.32, 0.28],
26     ¦   ¦   ¦   ¦[0.34, 0.31, 0.38, 0.40, 0.92, 0.28]])
27
28 data_labels = ('艺术家', '实验员', '工程师', '推销员', '社会工作者','记事员')#图例标签
29 angles = np.linspace(0, 2*np.pi, nAttr, endpoint=False)#弧度
30
31
32 data = np.concatenate((data, [data[0]]))        #闭合
33 angles = np.concatenate((angles, [angles[0]]))  #闭合
34
35 fig = plt.figure(facecolor="white")
36 plt.subplot(111, polar=True)
37 plt.plot(angles,data,'o-', linewidth=1, alpha=0.2)#极坐标的 plot的angles必须是弧度值,否则数据会显示异常
38 plt.fill(angles,data, alpha=0.25)
39 plt.thetagrids(angles*180/np.pi, radar_labels, fontproperties=zhfont)
40 plt.figtext(0.52, 0.95, '霍兰德人格分析', ha='center', size=20, fontproperties=zhfont)
41
42 legend = plt.legend(data_labels, loc=(0.94, 0.80), labelspacing=0.1, prop=zhfont)
43 plt.setp(legend.get_texts(), fontsize='large')
44 plt.grid(True)
45 plt.savefig('holland_radar1.jpg')
46
47 plt.show()
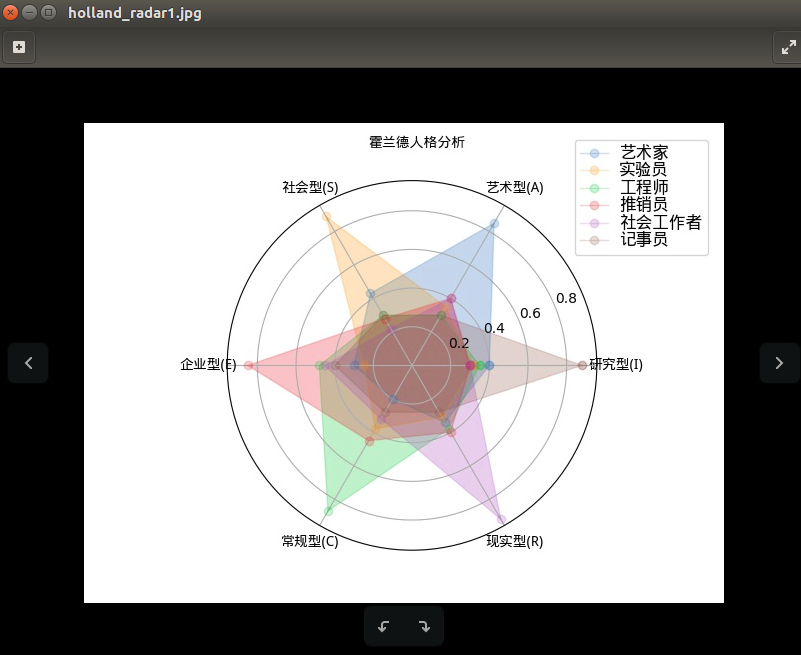
Q1:图例中每种成员的颜色是怎样和极坐标相应的成员的颜色相对应的呢?且听下回分解