I’m sure you’ve all heard that assigning a variable to null helps the Garbage Collector, or not declaring a method final improves in lining…. But what you also know is that JVMs have evolved drastically and what was true yesterday may not be true today. So, how do we know that our code performs? Well, we don’t, because we are not supposed to guess what the JVM does… we just measure!
Measure, don’t guess!
As my friend Kirk Pepperdine once said, “Measure, don’t guess“. We’ve all faced performance problems in our projects and were asked to tune random bits in our source code… hoping that performance will get improved. Instead, we should setup a stable performance environment (operating system, JVM, application server, database…), measure continuously, set some performance goals… then, take action when our goals are not achieved. Continuous delivery, continuous testing… is one thing, but continuous measuring is another step.
Anyway, performance is a dark art and it’s not the goal of this blog post. No, I just want to focus on microbenchmarking and show you how to use JMH on a real use case : logging.
Microbenchmarking Logging
I’m sure that, like me, you’ve spent the last decades going from one logging framework to another one and you’ve seen different ways to write debug logs:
logger.debug("Concatenating strings " + x + y + z);

logger.debug("Using variable arguments {} {} {}", x, y, z);

if (logger.isDebugEnabled()){
  logger.debug("Using the if debug enabled {} {} {}", x, y, z);
}
These are all debug messages and we usually don’t care because in production we run with an INFO or WARNING level. But debug logs can have an impact on our performances… even if we are in WARNING level. To prove it, we can use Java Microbenchmarking Harness (JMH) to make a quick microbenchmark and measure the performance of the three logging mechanism: Concatenating strings, Using variable arguments and Using the if debug enabled.
Setting up JMH
JMH is a Java harness for building, running, and analysing nano/micro/milli/macro benchmarks written in Java and other languages targeting the JVM. It’s really easy to setup and, thanks to the Maven archetype, we can quickly get a JMH project skeleton and get going. For that, execute the following Maven command:
mvn archetype:generate -DinteractiveMode=false -DarchetypeGroupId=org.openjdk.jmh \
      -DarchetypeArtifactId=jmh-java-benchmark-archetype -DarchetypeVersion=1.4.1 \
      -DgroupId=org.agoncal.sample.jmh -DartifactId=logging -Dversion=1.0
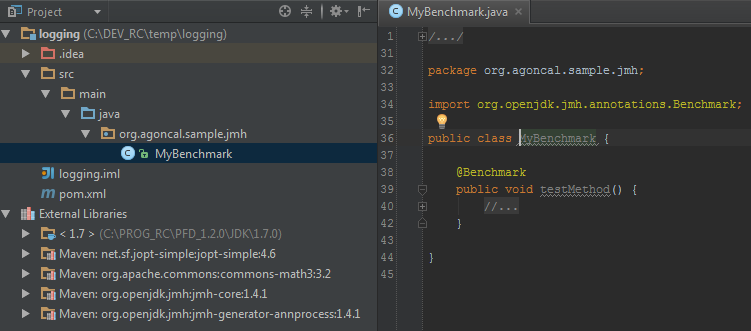
This Maven archetype creates the following project structure:
- A pom.xml file with the JMH dependencies and a customized maven-shade-plugin to get a uber-jar
- An empty MyBenchmark class with a @Benchmark annotation
At this point we haven’t done anything yet, but the microbenchmark project is already up and running. Packaging the code with Maven will create a uber-jar called benchmarks.jar.
$ mvn clean install
$ java -jar target/benchmarks.jar
When we execute the uber-jar, we see a funny output in the console: JMH goes into a loop, warms up the JVM, executes the code inside the method annotated @Benhmark (empty method for now) and gives us the number of operations per seconds
# Run progress: 30,00% complete, ETA 00:04:41
# Fork: 4 of 10
# Warmup Iteration   1: 2207650172,188 ops/s
# Warmup Iteration   2: 2171077515,143 ops/s
# Warmup Iteration   3: 2147266359,269 ops/s
# Warmup Iteration   4: 2193541731,837 ops/s
# Warmup Iteration   5: 2195724915,070 ops/s
# Warmup Iteration   6: 2191867717,675 ops/s
# Warmup Iteration   7: 2143952349,129 ops/s
# Warmup Iteration   8: 2187759638,895 ops/s
# Warmup Iteration   9: 2171283214,772 ops/s
# Warmup Iteration  10: 2194607294,634 ops/s
# Warmup Iteration  11: 2195047447,488 ops/s
# Warmup Iteration  12: 2191714465,557 ops/s
# Warmup Iteration  13: 2229074852,390 ops/s
# Warmup Iteration  14: 2221881356,361 ops/s
# Warmup Iteration  15: 2240789717,480 ops/s
# Warmup Iteration  16: 2236822727,970 ops/s
# Warmup Iteration  17: 2228958137,977 ops/s
# Warmup Iteration  18: 2242267603,165 ops/s
# Warmup Iteration  19: 2216594798,060 ops/s
# Warmup Iteration  20: 2243117972,224 ops/s
Iteration   1: 2201097704,736 ops/s
Iteration   2: 2224068972,437 ops/s
Iteration   3: 2243832903,895 ops/s
Iteration   4: 2246595941,792 ops/s
Iteration   5: 2241703372,299 ops/s
Iteration   6: 2243852186,017 ops/s
Iteration   7: 2221541382,551 ops/s
Iteration   8: 2196835756,509 ops/s
Iteration   9: 2205740069,844 ops/s
Iteration  10: 2207837588,402 ops/s
Iteration  11: 2192906907,559 ops/s
Iteration  12: 2239234959,368 ops/s
Iteration  13: 2198998566,646 ops/s
Iteration  14: 2201966804,597 ops/s
Iteration  15: 2215531292,317 ops/s
Iteration  16: 2155095714,297 ops/s
Iteration  17: 2146037784,423 ops/s
Iteration  18: 2139622262,798 ops/s
Iteration  19: 2213499245,208 ops/s
Iteration  20: 2191108429,343 ops/s
Adding SLF4j to the benchmark
Remember that the use case is to microbench logging. In the created project I use SFL4J with Logback. So I need to add those dependencies to the pom.xml
<dependency>
  <groupId>org.slf4j</groupId>
  <artifactId>slf4j-api</artifactId>
  <version>1.7.7</version>
</dependency>
<dependency>
  <groupId>ch.qos.logback</groupId>
  <artifactId>logback-classic</artifactId>
  <version>1.0.11</version>
</dependency>
Then I add a logback.xml file which outputs only INFO logs (so I’m sure that the debug level traces are not logged) :
<configuration>
  <appender name="CONSOLE" class="ch.qos.logback.core.ConsoleAppender">
    <encoder>
      <pattern>%highlight(%d{HH:mm:ss.SSS} [%thread] %-5level %logger - %msg%n)</pattern>
    </encoder>
  </appender>

  <appender name="STDOUT" class="ch.qos.logback.core.ConsoleAppender">
    <encoder><pattern>%msg%n</pattern></encoder>
  </appender>

  <root level="INFO">
    <appender-ref ref="CONSOLE" />
  </root>
</configuration>
The good thing with the maven-shade-plugin is that when I package the application, all the dependencies, configuration files and so on, will all get flatten into the uber-jar target/benchmarks.jar.
Using String Concatenation in the Logs
Let’s do the first micro benchmark: using logs with string concatenation. The idea here is to take the MyBenchmark class and add the needed code into the method annotated with @Benchmark, and let JMH do the rest. So, we add a Logger, create a few string (x, y, z), do a loop, and log a debug message with string concatenation. This will look like this:
import org.openjdk.jmh.annotations.Benchmark;
import org.slf4j.Logger;
import org.slf4j.LoggerFactory;

public class MyBenchmark {

  private static final Logger logger = LoggerFactory.getLogger(MyBenchmark.class);

  @Benchmark
  public void testConcatenatingStrings() {

    String x = "", y = "", z = "";

    for (int i = 0; i < 100; i++) {
      x += i; y += i; z += i;

      logger.debug("Concatenating strings " + x + y + z);
    }
  }
}
To execute this micro benchmark, we do as usual, and we will see the iteration outputs :
$ mvn clean install
$ java -jar target/benchmarks.jar
Using Variable Arguments in the Logs
The second micro-benchmark is to use variable arguments in the logs instead of string concatenation. Just change the code, repackage, and execute it.
@Benchmark
public void testVariableArguments() {

  String x = "", y = "", z = "";

  for (int i = 0; i < 100; i++) {
    x += i; y += i; z += i;

    logger.debug("Variable arguments {} {} {}", x, y, z);
  }
}
Using a If Statement in the Logs
Last but not least, the good old isDebugEnabled() in the logs that is “supposed to optimize things”.
@Benchmark
public void testIfDebugEnabled() {

  String x = "", y = "", z = "";

  for (int i = 0; i < 100; i++) {
    x += i; y += i; z += i;

    if (logger.isDebugEnabled())
      logger.debug("If debug enabled {} {} {}", x, y, z);
  }
}
Result of the Microbenchmarks
After running the three micro-benhmarks we get what we had expected (remember, don’t guess, measure). The more operation per second, the better. So if we look at the last line of the following table, we notice that the best performance is with the isDebugEnabled and the worse is String concatenation. Then, as we can see, variable argument without isDebugEnabled is not bad either… plus we gain in visibility (less boiler plate code). So I’ll go with variable arguments !
| String concatenation | Variable arguments | if isDebugEnabled | |
| Iteration 1 | 57108,635 ops/s | 97921,939 ops/s | 104993,368 ops/s |
| Iteration 2 | 58441,293 ops/s | 98036,051 ops/s | 104839,216 ops/s |
| Iteration 3 | 58231,243 ops/s | 97457,222 ops/s | 106601,803 ops/s |
| Iteration 4 | 58538,842 ops/s | 100861,562 ops/s | 104643,717 ops/s |
| Iteration 5 | 57297,787 ops/s | 100405,656 ops/s | 104706,503 ops/s |
| Iteration 6 | 57838,298 ops/s | 98912,545 ops/s | 105439,939 ops/s |
| Iteration 7 | 56645,371 ops/s | 100543,188 ops/s | 102893,089 ops/s |
| Iteration 8 | 56569,236 ops/s | 102239,005 ops/s | 104730,682 ops/s |
| Iteration 9 | 57349,754 ops/s | 94482,508 ops/s | 103492,227 ops/s |
| Iteration 10 | 56894,075 ops/s | 101405,938 ops/s | 106790,525 ops/s |
| Average | 57491,4534 ops/s | 99226,5614 ops/s | 104913,1069 ops/s |
Conclusion
In the last decades JVMs have evolved drastically. Design pattern that would optimize our code ten years ago are not accurate anymore. The only way to be sure that one piece of code is better that another piece of code, is to measure it. JMH is the perfect tool to easily and quickly micro benchmark pieces of code, or like in this post, an external framework (logging, utility classes, date manipulation, apache commons….). Of course, reasoning about a small section of code is only one step because we usually need to analyze the overall application performance. Thanks to JMH this first step is easy to make.
And remember to check the JMH examples, it’s full of interesting ideas.