项目简介:
你是为国家公园服务的生物多样性分析师。你将帮助他们分析一些关于不同国家公园物种的数据。 注意:您将在这个项目中使用的数据是受到真实数据的启发,但大部分是虚构的。
工具:JUPYTER NOTEBOOK
首先载入pandas 和 matplotlib
import pandas as pd
from matplotlib import pyplot as plt
1、您已经获得了两个CSV文件。提供关于我们国家公园中不同物种的数据,包括:
- 每个物种的学名
- 每一物种的常用名称
- 物种保育情况
- 加载数据集并检查它:
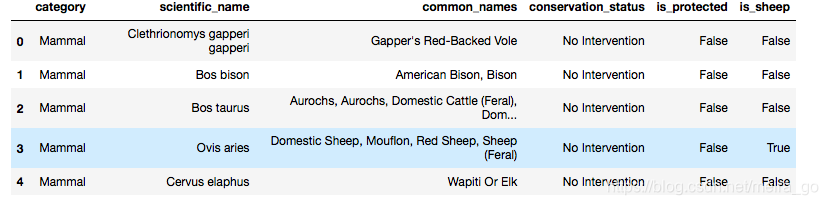
- 将species_info.csv加载到一个名为species的数据流中
species = pd.read_csv('species_info.csv')
print (species.head())
结果长这样:
2、接着了解我们的数据:
- 这个表提供了多少不同的物种,注意查询“distinct value”用 .nunique(
)
species.scientific_name.nunique()
结果是:5541
- 这个表提供了哪些物种分类?查询分类用.unique ()
- 目前的保护状态有多少种?
species.category.unique()
species.conservation_status.unique()
结果发现物种分类有哺乳类、鸟类、鱼 ; 保护状态有濒危、在恢复等
3、让我们开始做一些分析吧!
列conservation_status有几个可能的值:
受关注的物种:数量减少或似乎需要保护
受威胁的:在不久的将来易受危害的
濒临灭绝的:濒临灭绝的
在恢复中:以前处于濒危状态,但在其全部或大部分范围内都没有濒临灭绝的危险
我们想要计算出有多少物种符合这些标准。使用groupby来计算有多少scientific_name满足这些条件。
!记住末尾要加上.reset_index()
species.groupby('conservation_status').scientific_name.nunique().reset_index()
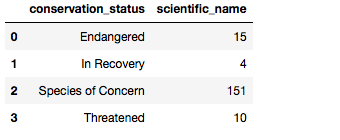
可以看出concern 的最多
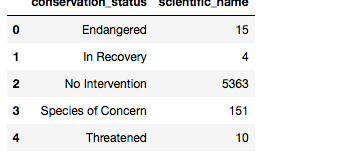
正如我们之前看到的,在物种表中有超过200个物种。很明显,只有一小部分人需要某种保护。其余的具有conservation_status等于None。因为groupby不包含None,所以我们需要填充空值。我们可以用。fillna来做。我们以参数的形式传入我们想要填充的None值。
粘贴以下代码,并运行它,看看取代没有任何干预:
species.fillna('No Intervention', inplace=True)
再次运行groupby去查看结果:
species.groupby('conservation_status').scientific_name.nunique().reset_index()
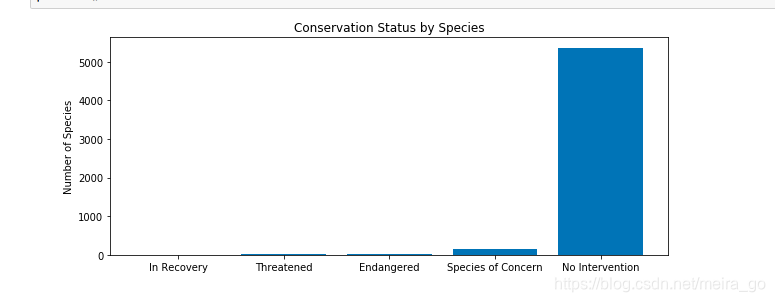
4、让我们用plt。创建一个条形图。
首先,让我们根据每个类别中有多少物种来对这些列进行排序。我们可以使用.sort_values实现这一点。我们使用关键字by来表示我们希望根据哪一列进行排序。
粘贴以下代码并运行它来创建一个名为protection_counts的新数据aframe,它是按scientific_name排序的:
protection_counts = species.groupby('conservation_status')\
    .scientific_name.nunique().reset_index()\
    .sort_values(by='scientific_name')
plt.figure(figsize=(10, 4))
ax = plt.subplot()
plt.bar(range(len(protection_counts)),
        protection_counts.scientific_name.values)
ax.set_xticks(range(len(protection_counts)))
ax.set_xticklabels(protection_counts.conservation_status.values)
plt.ylabel('Number of Species')
plt.title('Conservation Status by Species')
plt.show()
5、 某些种类的物种更有可能濒临灭绝吗?
- 让我们在物种中创建一个名为is_protected的新列,如果conservation_status不等于No
invervention,则为真,否则为假。
species['is_protected'] = species.conservation_status != 'No Intervention'
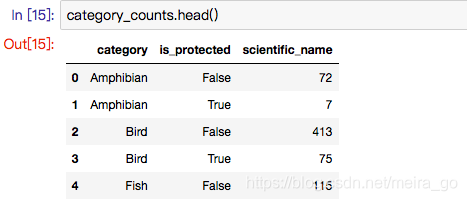
- 让我们根据category和is_protected列对物种数据框架进行分组,并计算每个分组中惟一的科学名称。
将结果保存到category_counts中。
category_counts = species.groupby(['category', 'is_protected'])\.scientific_name.nunique().reset_index()
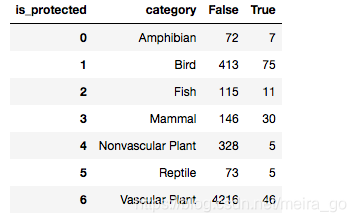
利用透视表pivot去更好的呈现,关于pivot的介绍:pivot_table有四个最重要的参数index、values、columns、aggfunc,
category_pivot = category_counts.pivot(columns='is_protected',index='category',values='scientific_name')\.reset_index()
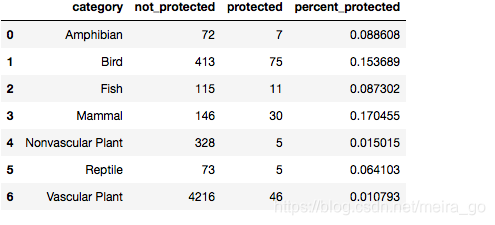
- 重新命名:category 为category, False 为not_protected
True 为 protected:
category_pivot.columns = ['category', 'not_protected', 'protected']
让我们创建一个名为percent_protected的category_pivot新列,它等于protected(受保护的物种数量)除以protected加上not_protected(物种总数)。
category_pivot['percent_protected'] = category_pivot.protected / \(category_pivot.protected + category_pivot.not_protected)
- 看起来哺乳动物比鸟类更有可能濒临灭绝(如果我们得到的p值小于0.05,那么两个数据集之间存在显著差异)
我们要做一个显著性检验看看这个表述是否正确。
基于这些答案,你应该选择做一个卡方测试。为了运行chi squared测试,我们需要创建一个列联表。我们的列联表应该是这样的:
||保护|不保护|| -|-|-| |哺乳动物|? |0 ?鸟| | | | ? |
创建一个名为权变(contingency)的表,并用正确的数字填充它
contingency = [[30, 146],
              [75, 413]]
from scipy.stats import chi2_contingency
chi2_contingency(contingency)
结果:(0.16170148316545571,
0.68759480966613362,
1,
array([[ 27.8313253, 148.1686747],
[ 77.1686747, 410.8313253]]))
6、在过去的7天里,自然资源保护者们在几个国家公园里记录下了不同物种的踪迹。他们已经将他们的观察结果保存在一个名为observations.csv的文件中。将observe .csv加载到一个名为observation的变量中,然后使用head查看数据。
observations = pd.read_csv('observations.csv')
observations.head()
- 一些科学家正在研究在不同国家公园看到的羊的数量。不同种类的羊有几种不同的学名。我们想知道哪些排的物种指的是羊。请注意,下面的代码将告诉我们一个单词是否出现在字符串中:
str1 = 'This string contains Sheep'
'Sheep' in str1
str2 = 'This string contains Cows'
'Sheep' in str2
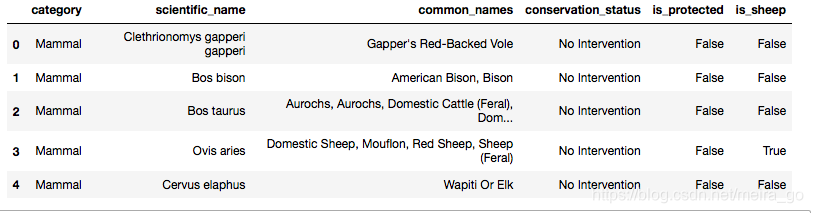
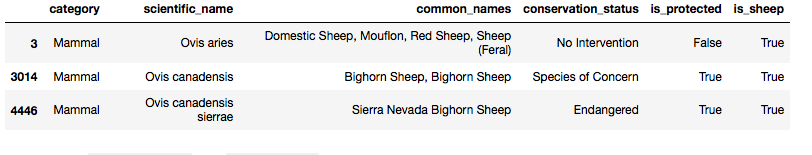
使用apply和lambda函数在物种中创建一个名为is_sheep的新列,如果
- common_names包含“Sheep”,则为真,否则为假。
species['is_sheep'] = species.common_names.apply(lambda x: 'Sheep' in x)
species.head()
- 选择is_sheep为真的物种的行,并检查结果。
species[species.is_sheep`]

- 许多结果实际上是植物。选择物种的行,其中is_sheep为真,category为哺乳动物。将结果保存到变量sheep_species。
sheep_species = species[(species.is_sheep) & (species.category == 'Mammal')]
sheep_species
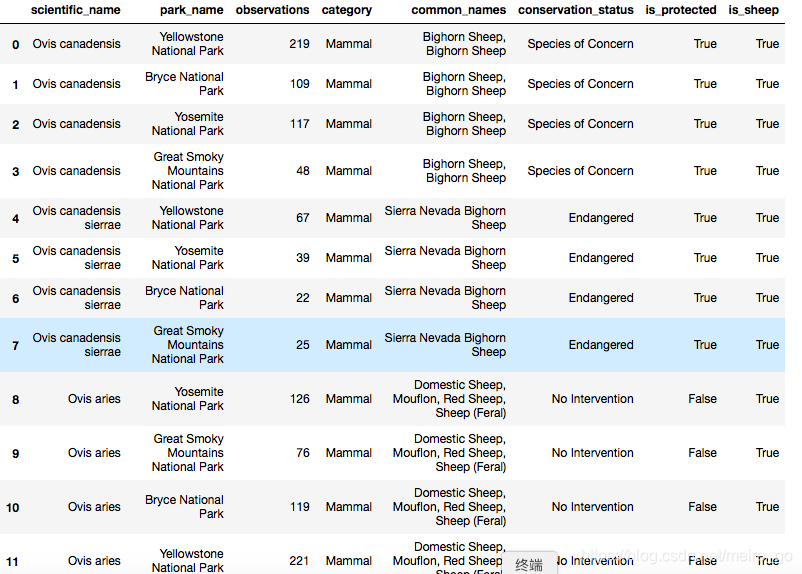
- 现在将sheep_species与观察值合并,以获得与绵羊观察值相匹配的数据流。将这个数据frame保存为sheep_observation。
sheep_observations = observations.merge(sheep_species)
sheep_observations
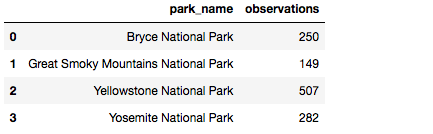
- 在每个国家公园总共观察了多少只羊(三种)?使用groupby获得每个park_name的观察值的总和。将您的答案保存到obs_by_park。
这是过去7天在每个公园观察到的羊的总数。
obs_by_park = sheep_observations.groupby('park_name').observations.sum().reset_index()
obs_by_park
- plt展示:
> Create a bar chart showing the different number of observations per
> week at each park. Start by creating a wide figure with figsize=(16,
> 4) Start by creating an axes object called ax using plt.subplot.
> Create a bar chart whose heights are equal to observations column of
> obs_by_park. Create an x-tick for each of the bars. Label each x-tick
> with the label from park_name in obs_by_park Label the y-axis Number
> of Observations Title the graph Observations of Sheep per Week Plot
> the grap using plt.show() ```

```python
plt.figure(figsize=(16, 4))
ax = plt.subplot()
plt.bar(range(len(obs_by_park)),
        obs_by_park.observations.values)
ax.set_xticks(range(len(obs_by_park)))
ax.set_xticklabels(obs_by_park.park_name.values)
plt.ylabel('Number of Observations')
plt.title('Observations of Sheep per Week')
plt.show()
- 我们的科学家知道布莱斯国家公园15%的羊患有口蹄疫。黄石国家公园的护林员一直在执行一项降低该公园口蹄疫发病率的计划。科学家们想测试这个程序是否有效。他们希望能够检测到至少5个百分点的下降。例如,如果黄石公园有10%的羊患有口蹄疫,它们希望能够自信地知道这一点。
使用样本大小计算器来计算他们需要从每个公园观察的羊的数量。使用默认的重要性级别(90%)。
minimum_detectable_effect = 100 * 0.05 / 0.15
minimum_detectable_effect
baseline = 15
sample_size_per_variant = 870
为了观察到足够多的羊,你需要在布莱斯国家公园观察几周?在黄石国家公园观察足够的羊需要几个星期?
bryce = 870 / 250.
yellowstone = 810 / 507.
