文件准备
1,文件名称
- telegraf-1.5.0_windows_amd64.zip
- influxdb-1.4.2_windows_amd64.zip
- grafana-4.6.3.windows-x64.zip
telegraf-1.5.0_windows_amd64.zip
wget https://dl.influxdata.com/telegraf/releases/telegraf-1.5.0_windows_amd64.zip
unzip telegraf-1.5.0_windows_amd64.zip
influxdb-1.4.2_windows_amd64.zip
wget https://dl.influxdata.com/influxdb/releases/influxdb-1.4.2_windows_amd64.zip
unzip influxdb-1.4.2_windows_amd64.zip
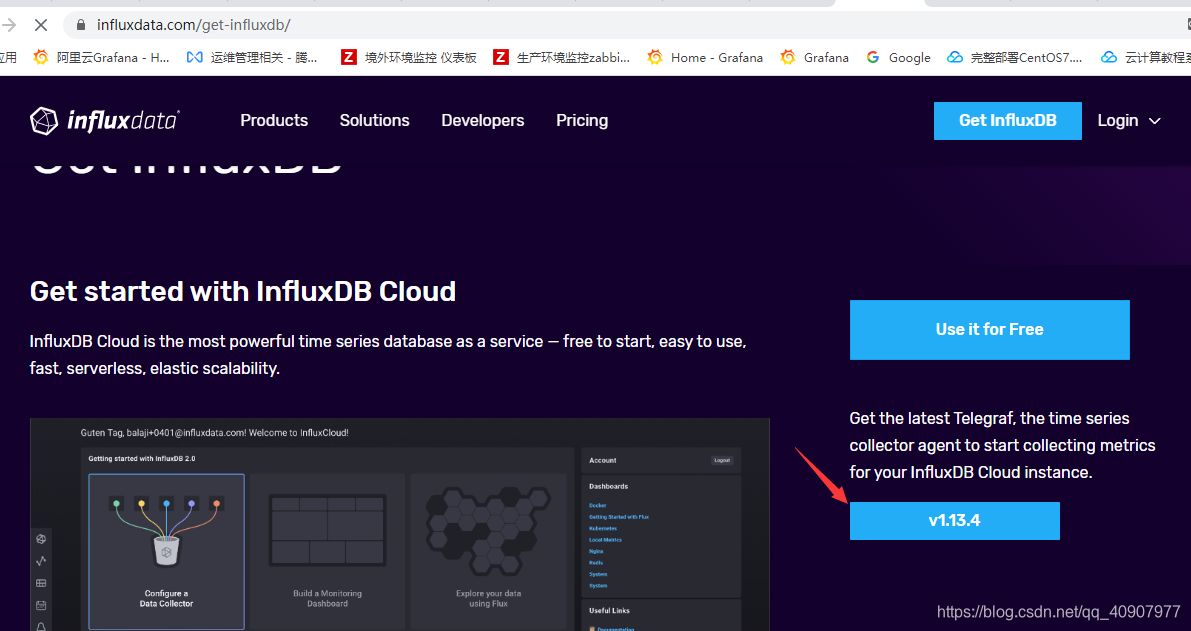
influxdb下载地址 :https://www.influxdata.com/get-influxdb/
grafana-4.6.3.windows-x64.zip
wget https://s3-us-west-2.amazonaws.com/grafana-releases/release/grafana-4.6.3.windows-x64.zip
unzip grafana-4.6.3.windows-x64.zip
可以用上面的命令进行下载,Windows可以用wget的命令,下载一个Windwos版的wget,进行环境变量的修改,OK
由于grafana仅仅只是提供界面显示, 所以他需要从influxdb中获取数据, 而influxdb中的数据又需要从其他地方收集过来, 常用的收集工具是collectd和telegraf, 其中collectd这里不做介绍, 有些数据不是太适合, 而 influxdb 自身集成 telegraf插件, 不需要进行专门的配置
collectd/telegraf(收集数据) -------> influxdb(保存数据) -------> grafana(显示数据)
以上就是他们三者之间的关系。
安装
直接解压到你想安装的目录下就行了,按照惯例,路径最好别有中文,但没有中文肯定是没问题的。,分别解压下载下来的文件到指定目录,比如:F:/Grafana
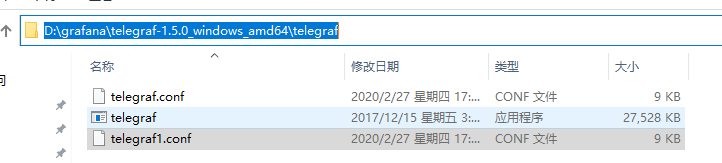
解压完目录

配置
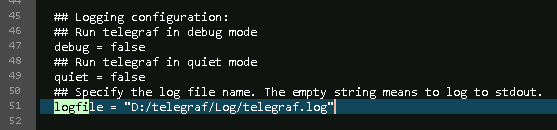
修改telegraf.conf文件,设置日志文件目录 ## Specify the log file name. The empty string means to log to stdout.
logfile = "F:/Grafana/server/telegraf/telegraf.log" ##你修改为自己定义的目录路径,其他的配置不要乱动。
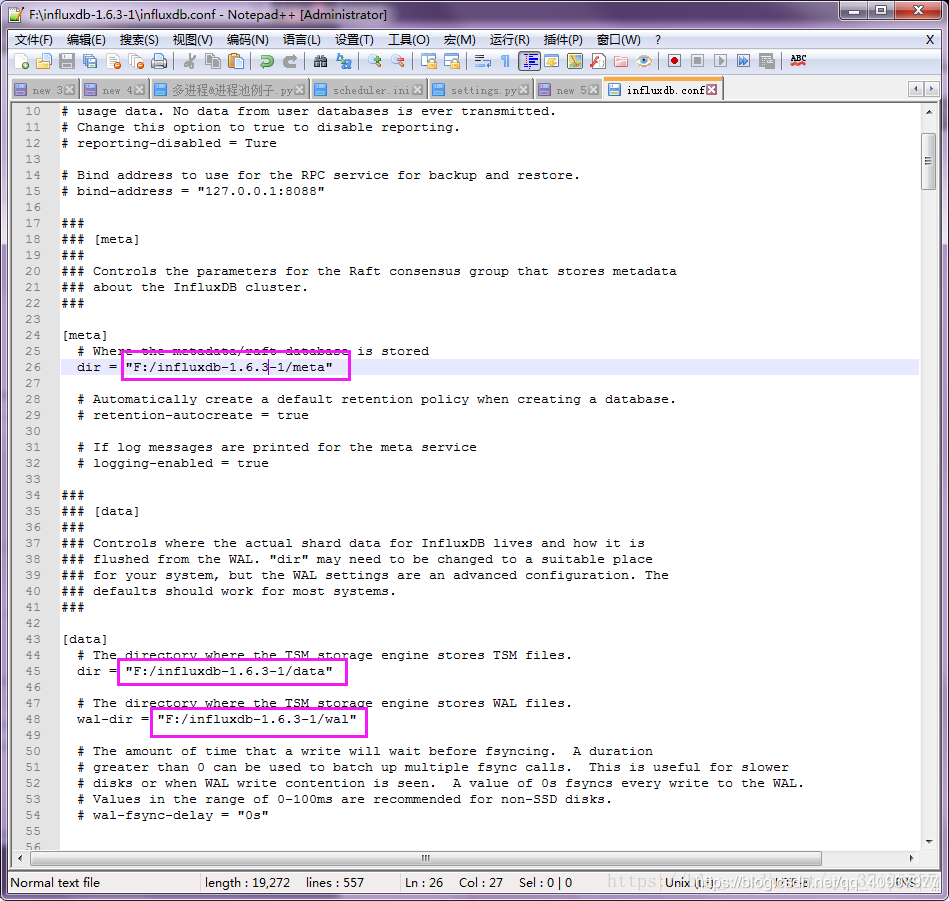
修改influxdb.conf,打开HTTP,修改数据保存的路径,也就是数据库文件 ## Where the metadata/raft database is stored
dir = "F:/Grafana/server/influxdb/meta"   ##修改为你自己的目录路径
#meta控制InfluxDB的Metastore的参数,该参数存储有关用户,数据库,保留策略,分片和连续查询的信息
3.修改influxdb.conf,打开HTTP,修改数据保存的路径,也就是数据库文件 ## The directory where the TSM storage engine stores TSM files.
dir = "F:/Grafana/server/influxdb/data"   ##修改为你自己的目录路径
#控制InfluxDB的实际分片数据的存在位置以及如何从WAL刷新数据
4.修改influxdb.conf,打开HTTP,修改数据保存的路径,也就是数据库文件 ## The directory where the TSM storage engine stores WAL files.
wal-dir = "F:/Grafana/server/influxdb/wal"    ##修改为你自己的目录路径
#存储WAL刷新数据
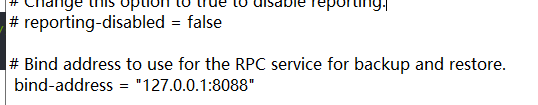
5.修改influxdb.conf,打开HTTP,修改数据保存的路径,也就是数据库文件 ## Determines whether HTTP endpoint is enabled.
  enabled = true  ## 开启,主要作用是接收telegraf的数据并存储,提供API给Grafana调用数据
    ### The bind address used by the HTTP service.
    bind-address = ":8086"   ## HTTP API使用的端口
InfluxDB 的数据存储主要有三个目录。默认情况下是 meta, wal 以及 data 三个目录,服务器运行后会自动生成。
- meta 用于存储数据库的一些元数据,meta 目录下有一个 meta.db 文件。
- wal 目录存放预写日志文件,以 .wal 结尾。
- data 目录存放实际存储的数据文件,以 .tsm 结尾。
说明:从版本1.3开始,InfluxDB中不再提供Web管理界面。接口不运行在端口上8083,InfluxDB忽略[admin]配置文件中的该部分。 Chronograf用改进的工具替代了网络管理界面,用于查询数据,写入数据和数据库管理。
或者使用InfluxDB+Telegraf+Chromograf+Kapacitor组件进行搭建监控(都有Windows版本)
命令行形式启动InfluxDB和Telegraf
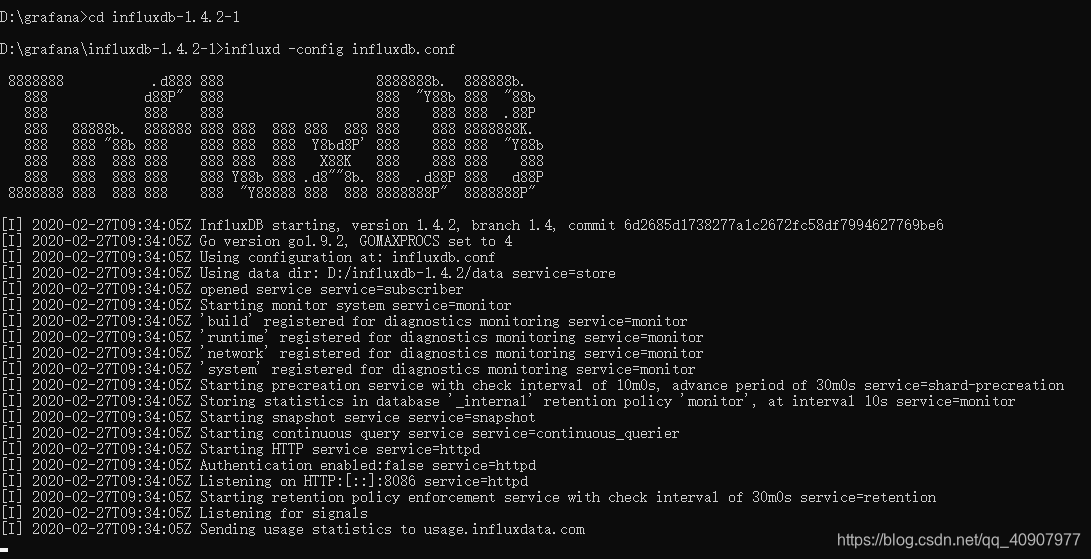
通过cmd命令窗口,切换到influxdb安装目录,执行如下命令:
influxd -config influxdb.conf
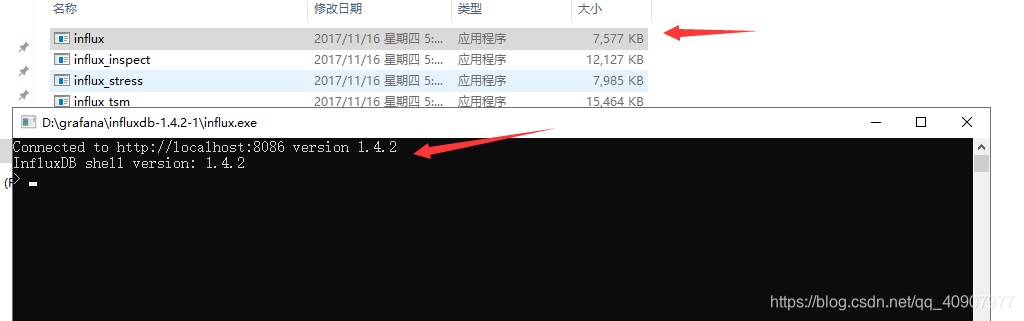
双击exe程序,就可以进入InfluxDB
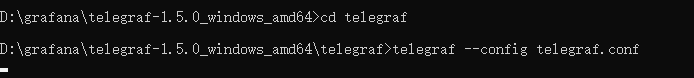
通过cmd命令窗口,切换到Telegraf安装目录,执行如下命令:
telegraf -config telegraf.conf
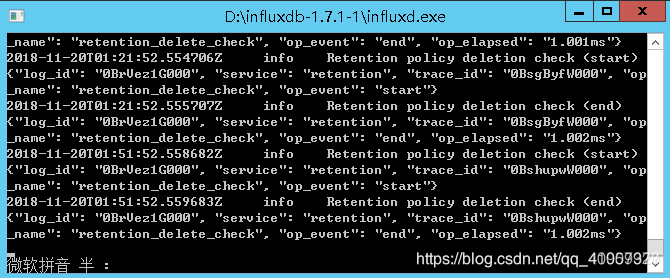
启动测试
此时,双击influxd.exe就好了,这是数据库连接,运行后,会出现一个命令行界面,而且是一直在运行,这是对的,因为一旦这个进程停止了,就可能是数据库连接断了,就无法操作数据库了。
在上面运行的基础上,再双击influx.exe,就会出现下面这样的数据库界面了,有一点点MySQL基础的同学应该对这个界面都不陌生吧。
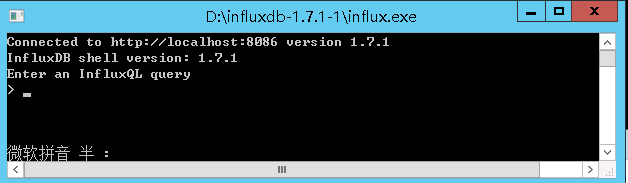
show databases
create database mydb
use mydb
show measurements   # measurements相当于的SQL中的tables
show series #看表
新建表和插入数据
新建表没有具体的语法,只是增加第一条数据时,会自动建立表
insert results,hostname=index1 value=1
> insert results,hostname=index1 value=1
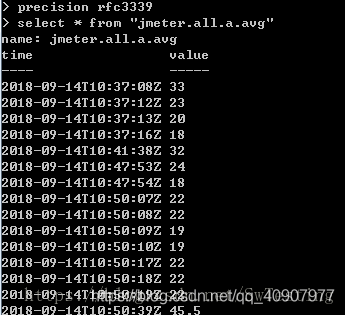
> select * from results
name: results
time hostname value
---- -------- -----
1555576798455199200 index1 1
>
查询数据
表名有点号时,输入双引号
新增用户:
--普通用户
create user "user" with password 'user'
--管理员用户
create user "admin" with password 'admin' with all privileges
Telegraf 安装配置
和上面一样,只要下载安装就行了。
在启动前,先设置一下日志文件目录,打开telegraf.conf文件,将此目录修改为自己的目录路径就行了(这个路径是自己新建的,原本不存在),其他的不要动:
启动测试也是一样,双击telegraf.exe就启动了。
原来在真正使用Telegraf 时,是要设置 input 和 output 地址的,于是照着官方的指导:先创建一个配置文件,(为防止覆盖原始配置文件,我命名为telegraf_2.conf),指定的输入为 cpu 和 内存(mem)状态,指定输出为 influxDB。
telegraf -sample-config -input-filter cpu:mem -output-filter influxdb > telegraf_2.conf
然后再次启动,当然,在这之前要先启动influxdb:
telegraf --config telegraf_2.conf
6.Grafana使用默认配置。
HTTP端口默认:3000
HTTP地址默认:localhost(127.0.0.1)
默认用户:admin
默认用户密码:admin

数据库类型:sqlite3   ##支持mysql,postgres等
数据库地址:localhost(127.0.0.1)
数据库端口: 3306
数据库名:grafana   ##如果在Windows下连接数据库请在grafana/data下找到grafana.db的文件,用Navicat连接
数据库登入用户:root
数据库登入密码:root
启动
4.1 Influxdb

通过cmd命令窗口,切换到influxdb安装目录,执行如下命令:

 influxd -config influxdb.conf

4.2 Telegraf

通过cmd命令窗口,切换到Telegraf安装目录,执行如下命令:

 telegraf -config telegraf.conf

4.3 Grafana

切换到Grafana安装目录中的bin目录下,双击grafana-server.exe启动程序
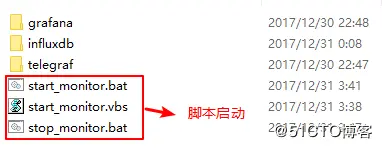
可以写一些脚本,如bat或vbs进行一键启动,并且后台运行。
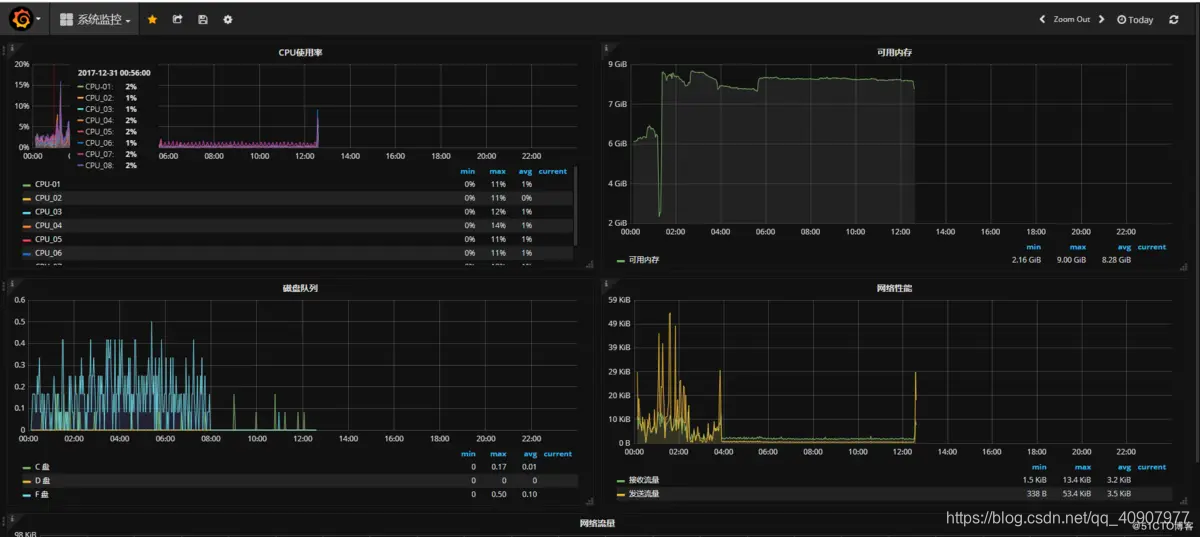
Windows下本机简易监控系统搭建(Telegraf+Influxdb+Grafana)
使用操作
打开Google Chrome,输入http://localhost:3000 , 使用admin/admin登录本机Grafana,新建influxdb数据源。
第一步:登入Grafana。
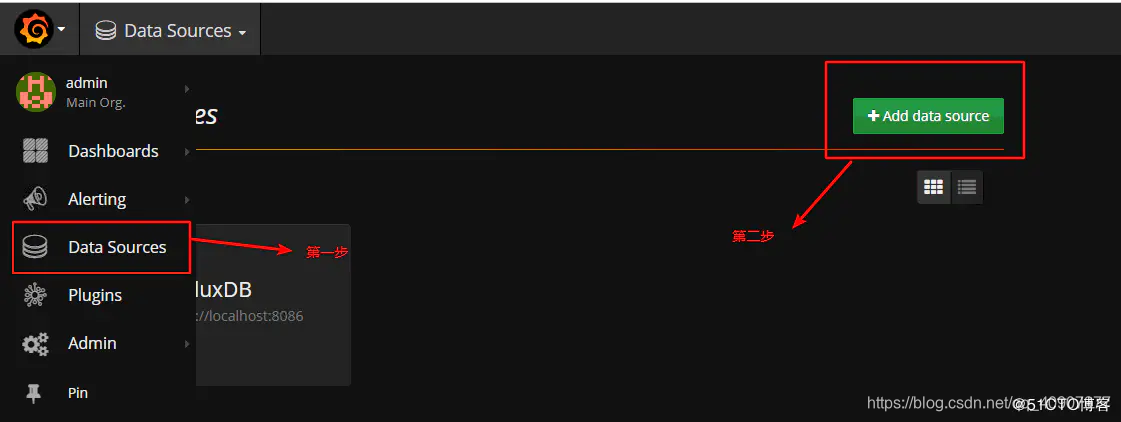
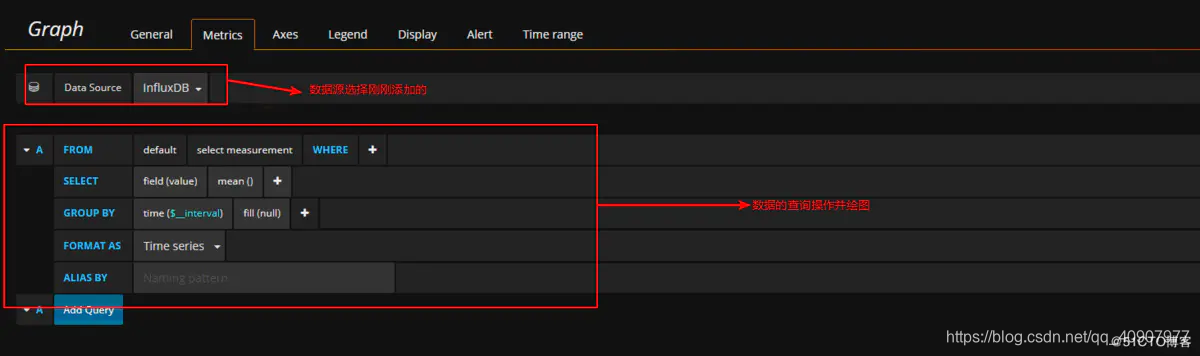
第二步,创建数据源

2.数据源的创建完成,就是进行模板的建立,数据查询操作,自动绘图
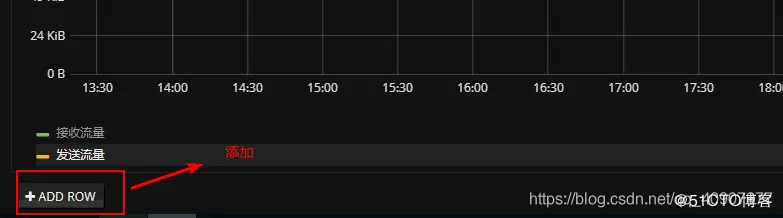
第一步:创建一个新的面板
New Dashboard 进行命名,描述,自定义。
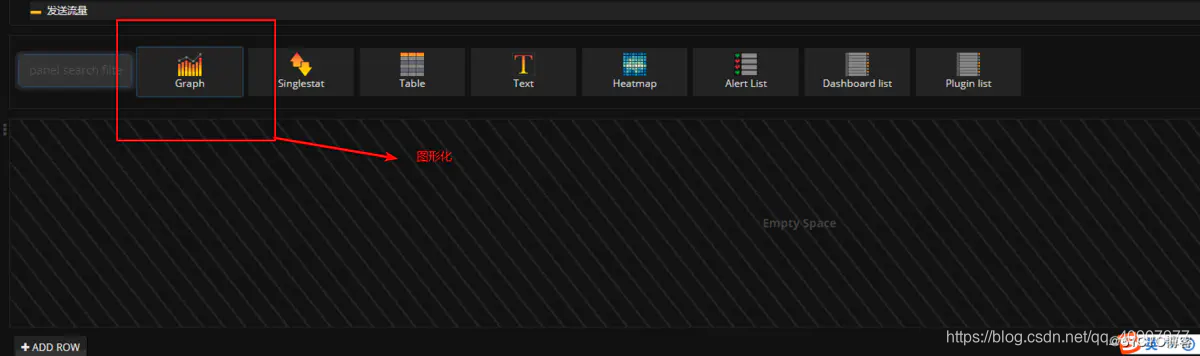
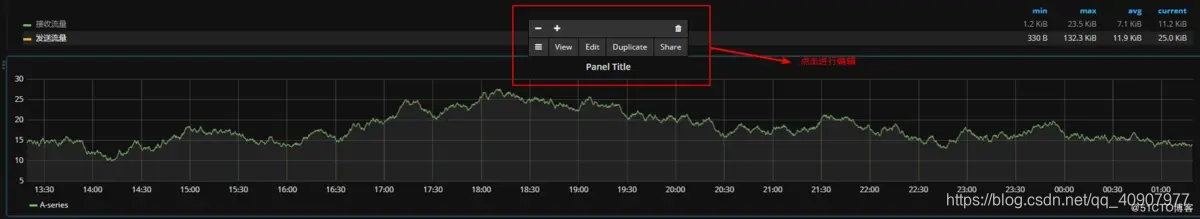
第二步:添加Graph

第三步:进行保存,页面最上角有个保存配置按钮
展示下我简单配置的图形:
扩展
https://www.influxdata.com/get-influxdb/
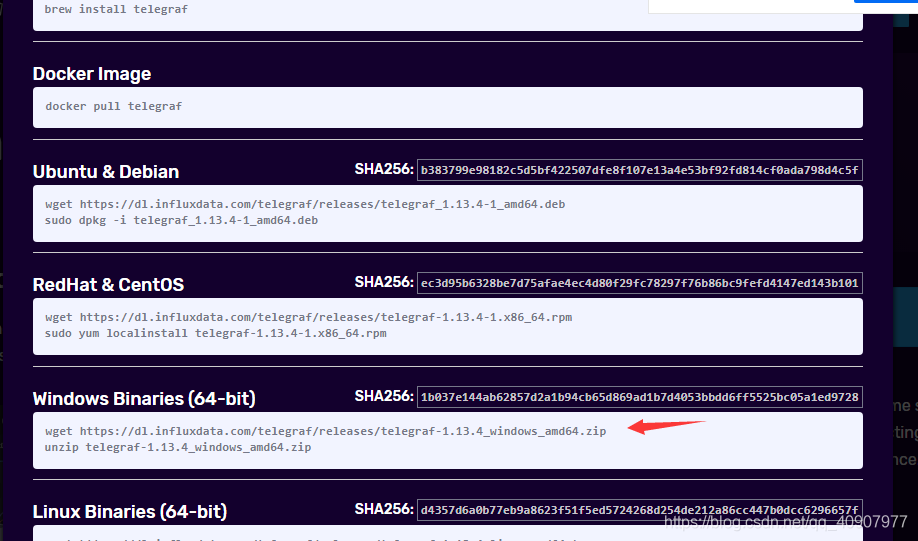
Windows Binaries (64-bit) SHA256: 1b037e144ab62857d2a1b94cb65d869ad1b7d4053bbdd6ff5525bc05a1ed9728
wget https://dl.influxdata.com/telegraf/releases/telegraf-1.13.4_windows_amd64.zip
unzip telegraf-1.13.4_windows_amd64.zip
influxdb设置开启https
https://docs.influxdata.com/influxdb/v1.4/administration/https_setup/#setup-https-with-a-self-signed-certificate
基于Telegraf和InfluxDB的url监控方案
https://www.annhe.net/article-3605.html
利用Metrics+influxdb+grafana构建监控平台
https://www.jianshu.com/p/fadcf4d92b0e
metrics小常识
http://blog.csdn.net/tracymkgld/article/details/51899721
简析运维监控系统及Open-Falcon
http://blog.csdn.net/puma_dong/article/details/51895063
NetkillerLinux Monitoring 手札
http://netkiller.github.io/monitoring/index.html
grafana+influxdb+telegraf监控服务器cpu,内存和硬盘
https://www.jianshu.com/p/dfd329d30891
Grafana搭建-优化zabbix图形显示
http://blog.51cto.com/ixhao/1847284
Telegraf+ InfluxDB收集系统性能,Grafana图形展示
http://blog.csdn.net/qq942477618/article/details/5957951
Windows下本机简易监控系统搭建(Telegraf+Influxdb+Grafana)
加粗样式
https://www.cnblogs.com/liugh/p/6683488.html
telegraf+influxdb+grafana+springboot构建监控平台
http://blog.csdn.net/soongp/article/details/66974529
使用 StatsD + Grafana + InfluxDB 搭建 Node.js 监控系统
https://www.v2ex.com/t/328124
InfluxDB系列学习教程目录
https://www.linuxdaxue.com/influxdb-study-series-manual.html
使用Prometheus+Grafana监控MySQL实践
http://www.ywnds.com/?p=9656
参考连接 :
https://blog.csdn.net/laisinanvictor/article/details/80007356
作者:啃西瓜的稻草人
链接:https://www.jianshu.com/p/1aef93026fab
[598]Windows版InfluxDB及相关软件安装与配置 : https://blog.csdn.net/xc_zhou/article/details/89478279
Windows下本机简易监控系统搭建(Telegraf+Influxdb+Grafana) : https://www.bbsmax.com/A/B0zq1GZZzv/
