telegraf安装:
参考文档
http://docs.influxdata.com/telegraf/v1.6/introduction/installation/
https://blog.csdn.net/w958660278/article/details/80484486
添加配置仓库
cat <<EOF | sudo tee /etc/yum.repos.d/influxdb.repo
[influxdb]
name = InfluxDB Repository - RHEL \$releasever
baseurl = https://repos.influxdata.com/rhel/\$releasever/\$basearch/stable
enabled = 1
gpgcheck = 1
gpgkey = https://repos.influxdata.com/influxdb.key
EOF
安装:centos7以下版本:
sudo yum install telegraf
sudo service telegraf start
centos7以上版本:
sudo yum install telegraf
sudo systemctl start telegraf
初始化配置文件:
telegraf config > telegraf.conf
配置文件地址:
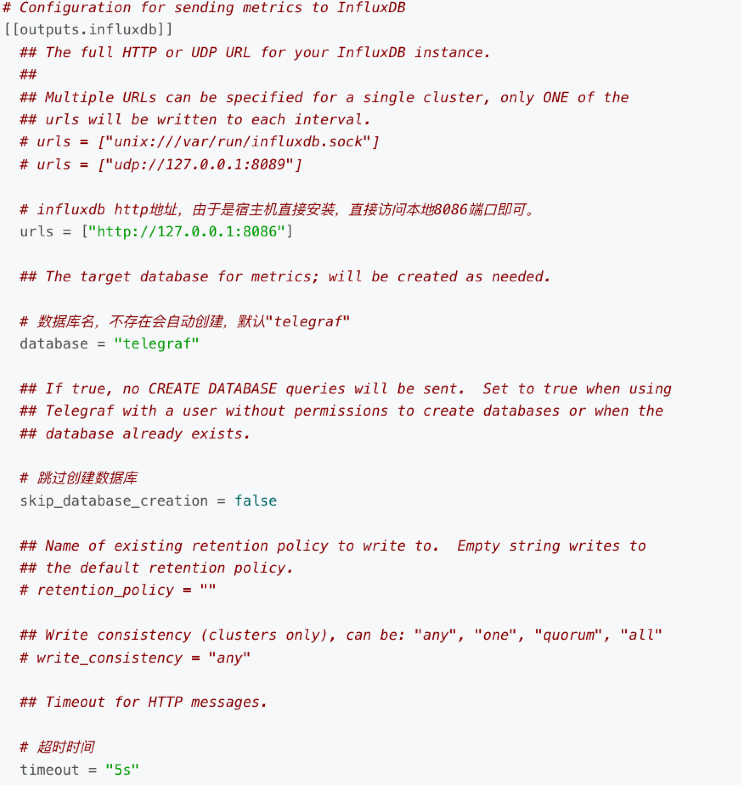
用户可修改Telegraf配置文件进行采集项的配置。配置文件默认位于/etc/telegraf/telegraf.conf。 在本文方案中,需要配置数据输出项(输出到influxdb),其它项使用telegraf默认即可。
vim /etc/telegraf/telegraf.conf 修改信息如下:
Grafana配置:
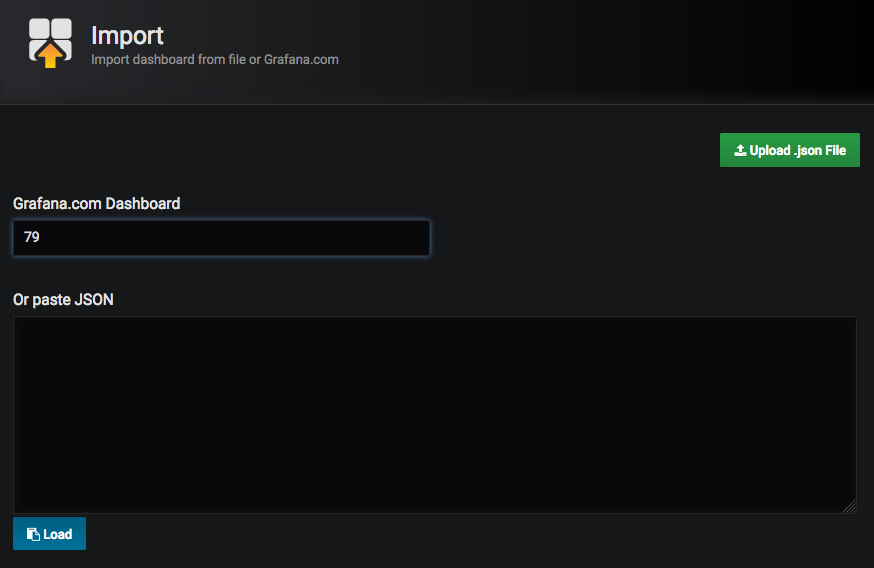
使用模板:Dynamic Dashboard code:79
导入模板方式
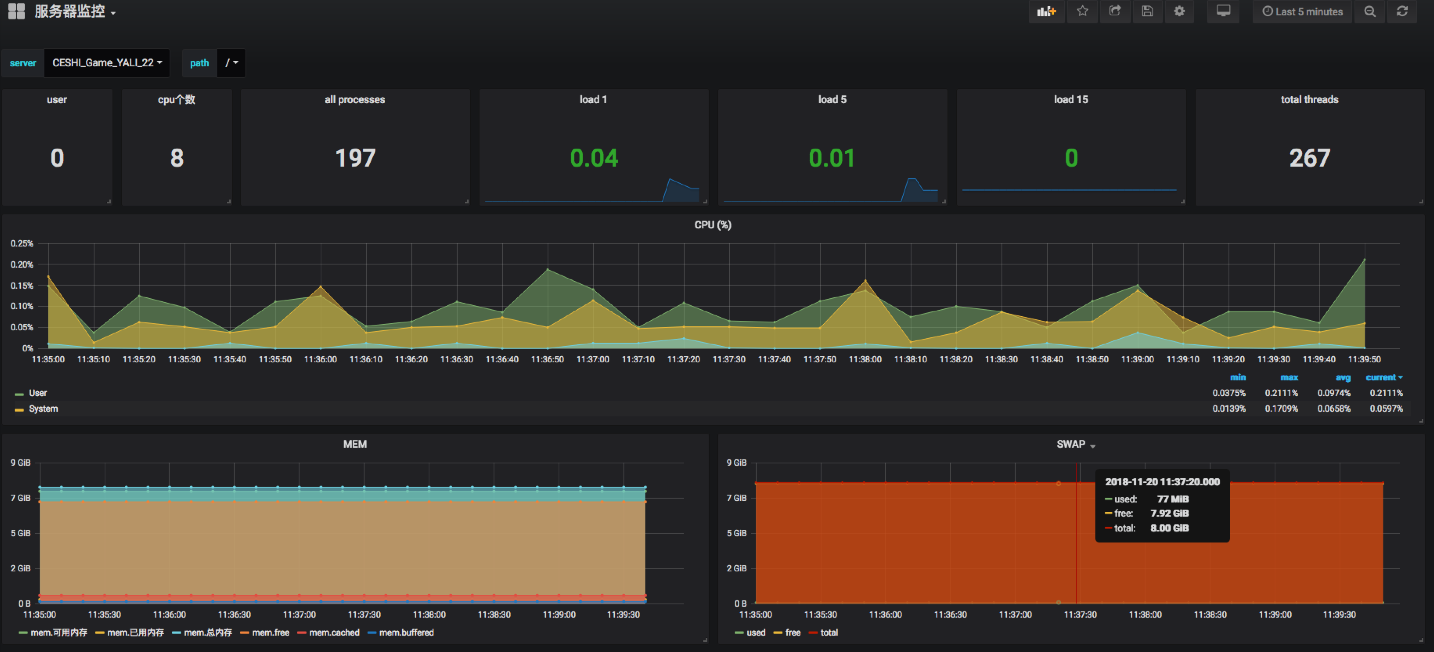
页面展示:
配置信息:
页面头部选项:
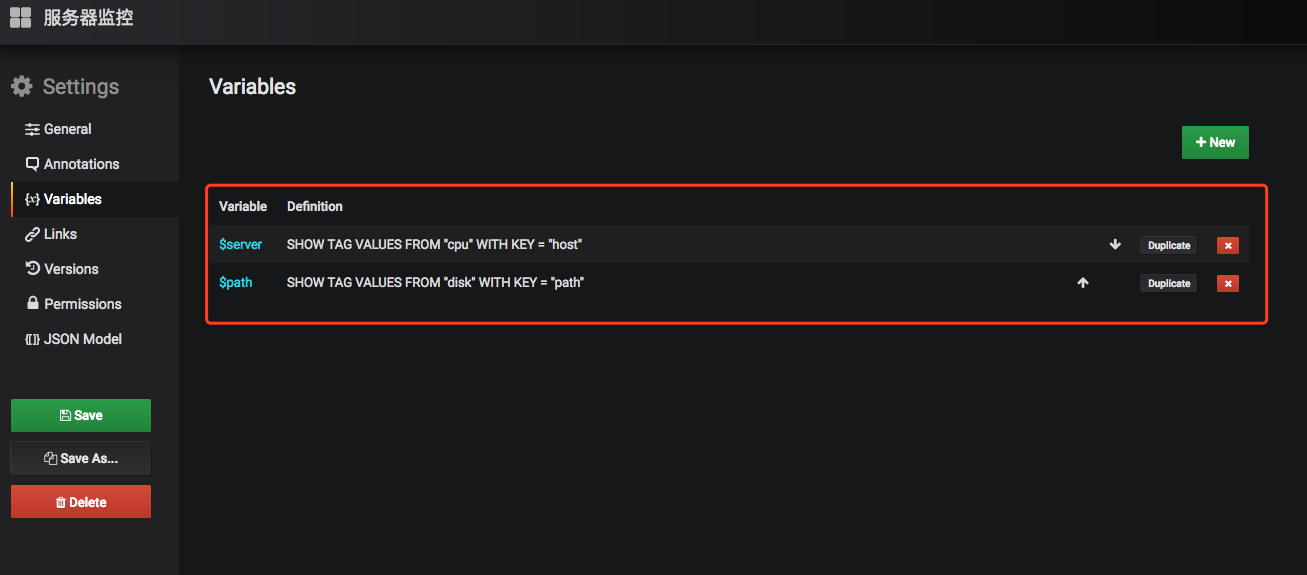
telegraf数据库信息:
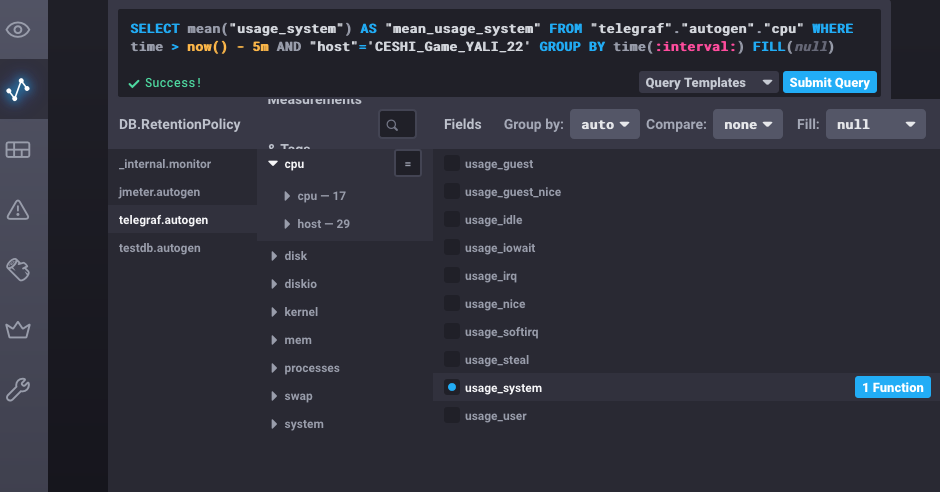
sql举例:
SELECT mean("usage_user") FROM "cpu" WHERE ("host" =~ /^$server$/) AND $timeFilter GROUP BY time($interval) fill(null)
("host" =~ /^$server$/):调用头部选择的host信息
$timeFilter 系统默认时间轴
time($interval) 选择默认时间间隔
CPU状态信息us,sy,ni,id,wa,hi,si,st含义
us 用户空间占用CPU百分比
sy 内核空间占用CPU百分比
ni 用户进程空间内改变过优先级的进程占用CPU百分比
id 空闲CPU百分比
wa 等待输入输出的CPU时间百分比
hi 硬件中断
si 软件中断
st: 实时