笔记中的某些图片,代码来自B站郭彦甫老师的PPT和视频
进阶绘图
进阶2D绘图(重要函数指令)
- logarithm plot对数图
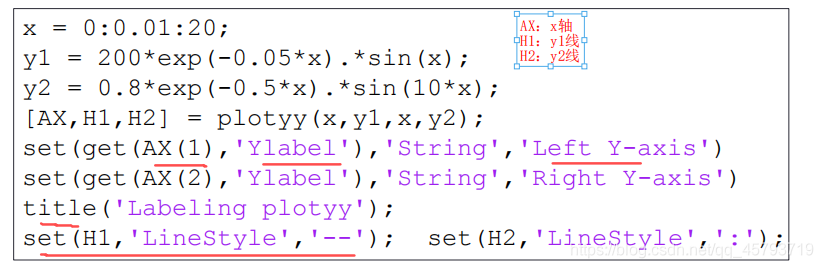
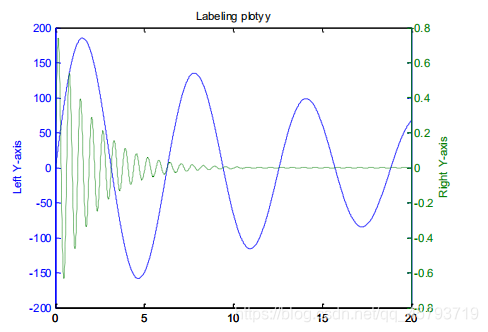
- plotyy
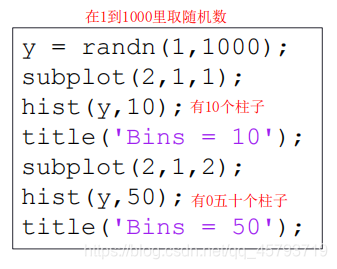
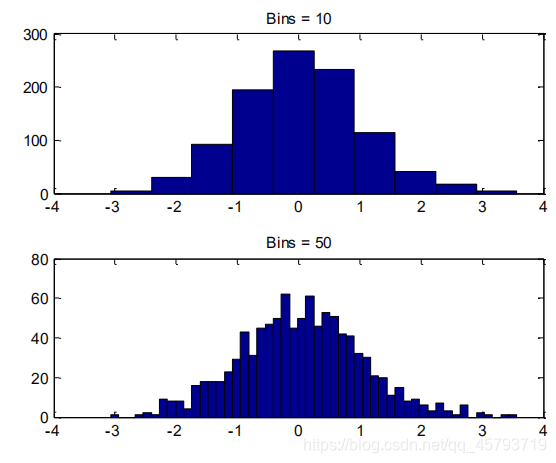
- histogram 统计图(整体)
- bar charts 统计图(个体)
- pie charts饼状图
- ploar chart (类似与极坐标图)
- stairs and stem charts
- boxplot and error bar
- fill 填充颜色和text
配色
- imagesc
- colorbar
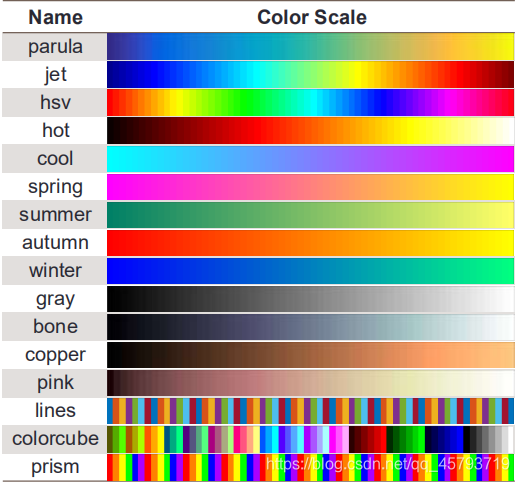
- colormap
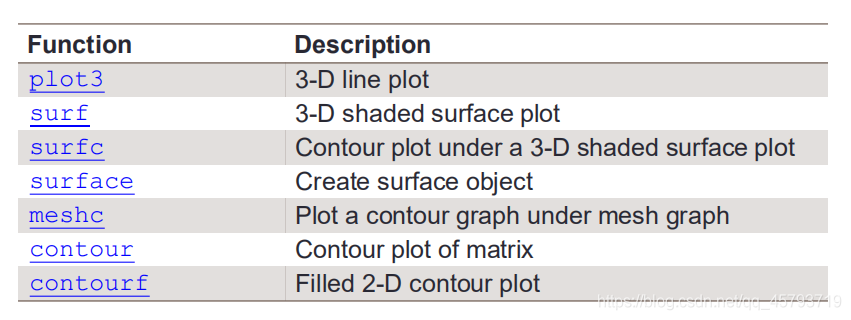
3D绘图函数
-
plot3(x,y,z)
-
3D surface plot:
1 meshgrid()
2 mash()和surf()
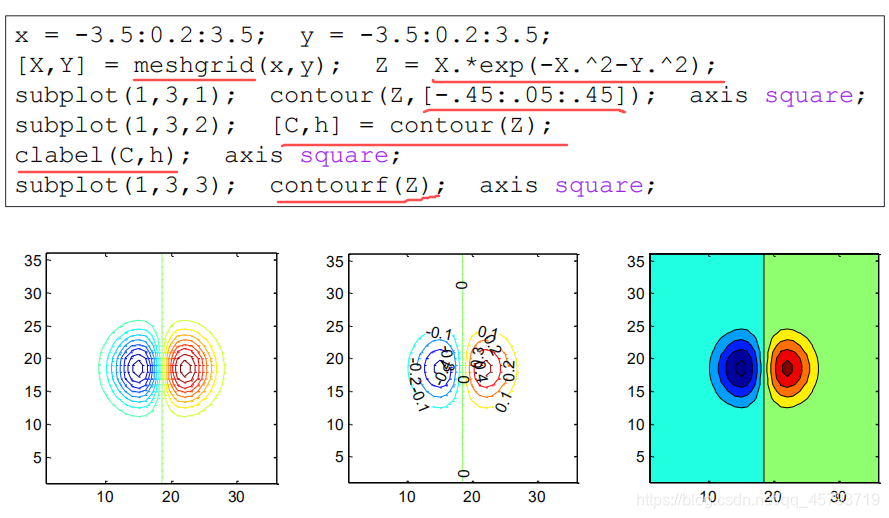
3 contour()
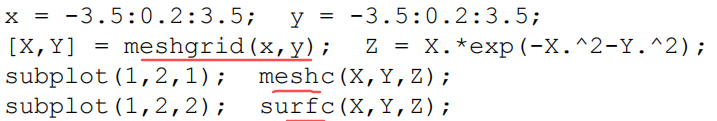
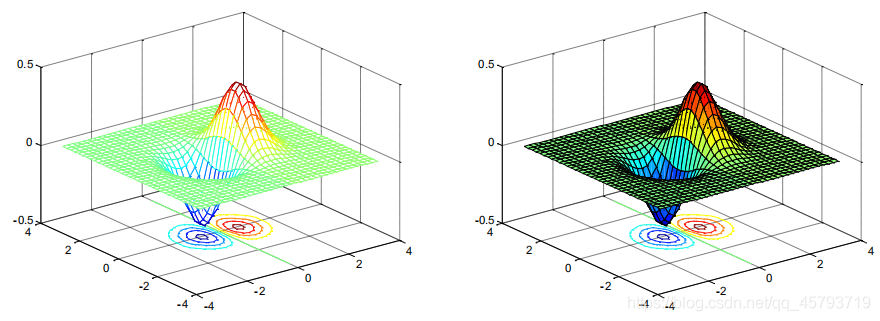
4 meshc() 和surfc()
5view()
6light()
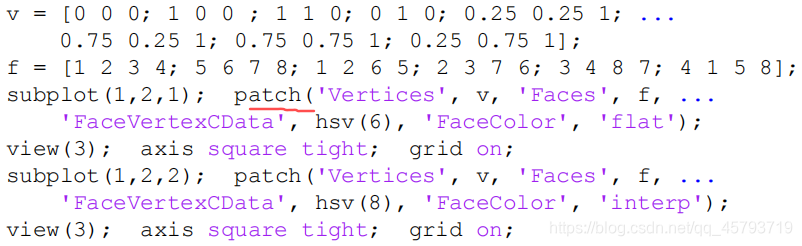
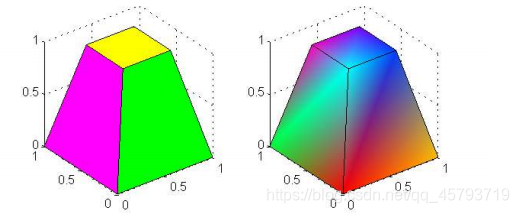
7patch()
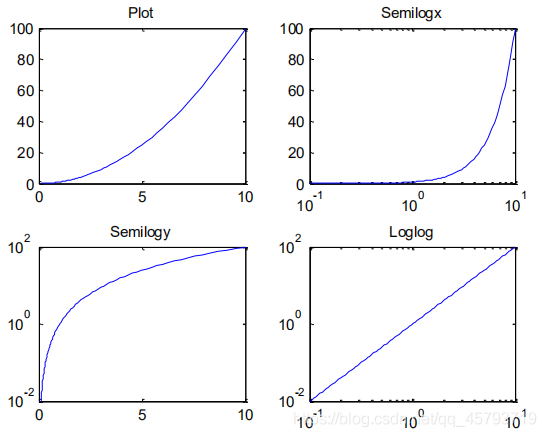
1.1对数图
semilogx(x,y):x轴取对数
loglog(x,y):x y轴都取对数
set(gca,‘XGrid’,‘on’);加网格
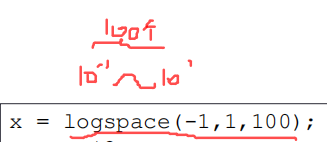
x=logspace(-1,1,100);
y=x.^2;
subplot(2,2,1); plot(x,y);title(‘Plot’);
subplot(2,2,2); semilogx(x,y);title(‘Semilogx’);
subplot(2,2,3); semilogy(x,y);title(‘Semilogy’);
subplot(2,2,4); loglog(x,y);title(‘LogLog’);
1.2
plotyy()
1.3histogram
hist(x,n)
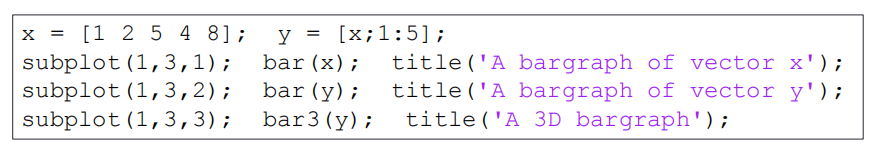
1.4
- bar(y)
- bar3(y)
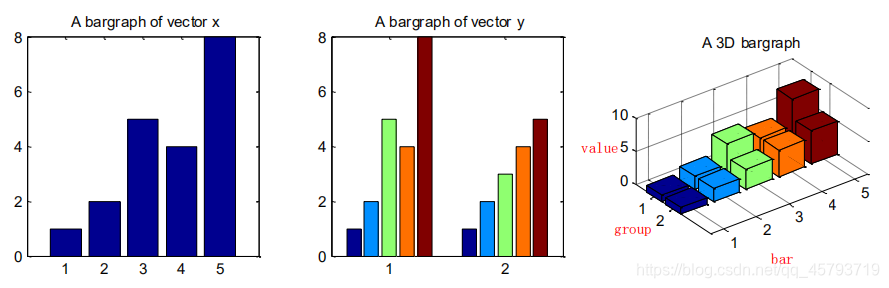
bar(y,‘stacked’); 叠在一起
barh(y); 横过来

x=[1 2 5 4 8];
y=[x;1:5];
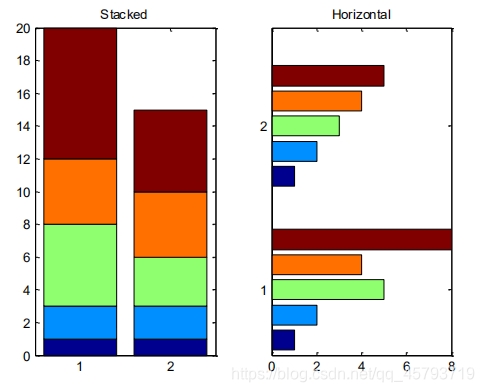
barh(y,‘stacked’);
1.5 饼状图
- pie();
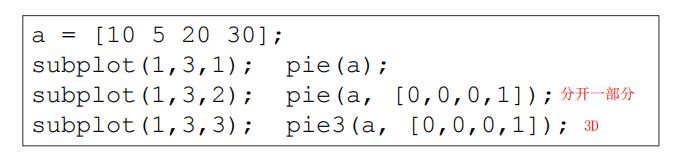
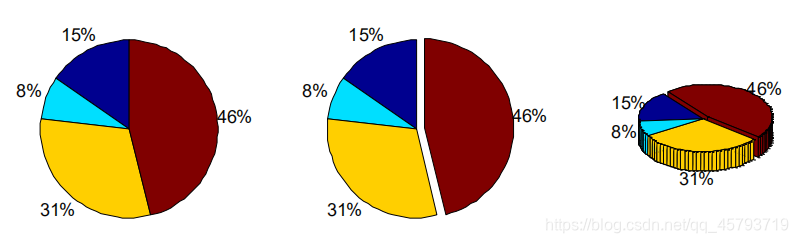

a=[10 5 20 30];
pie3(a,[1,1,1,1]);
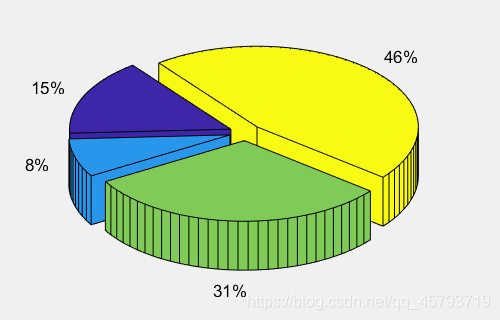
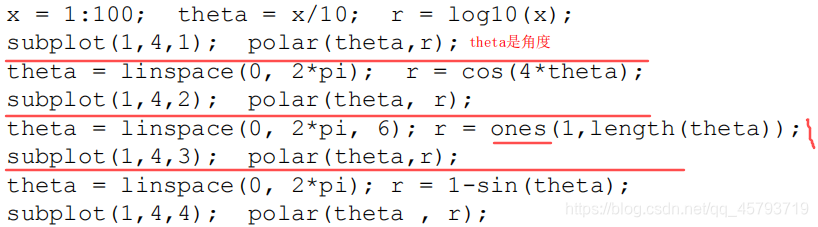
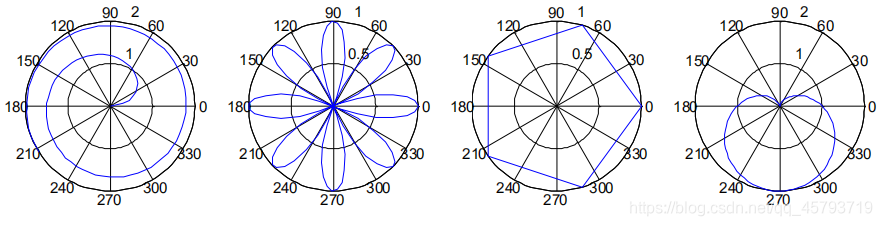
1.6
- polar(theta,r);其中theta是角度,r是半径
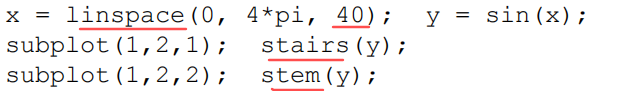
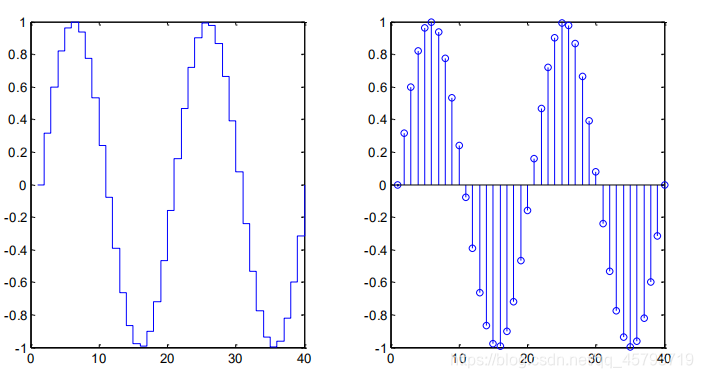
- stairs(y)
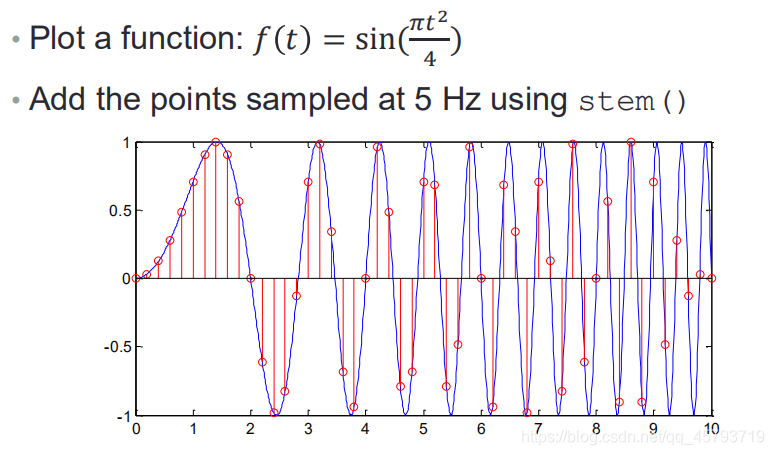
- stem(y)
疑问?
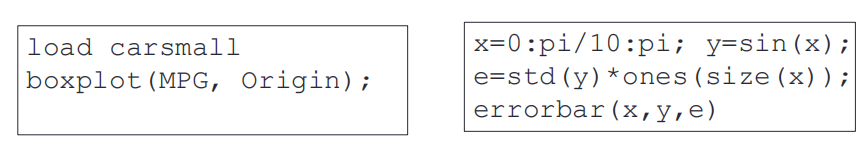
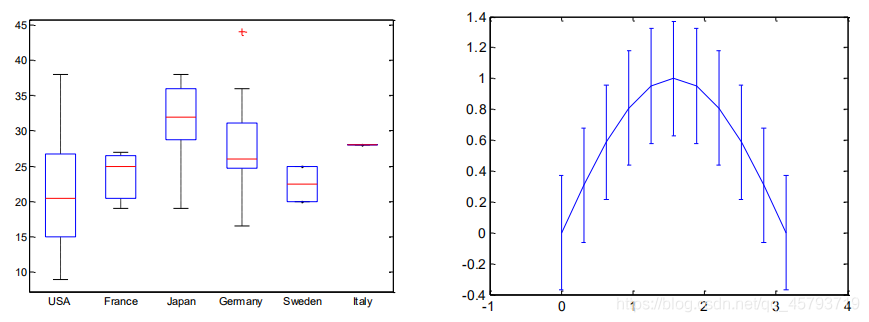
1.7
- boxplot(x,y)
- errorbar(x,y,e) 其中e是错误区间
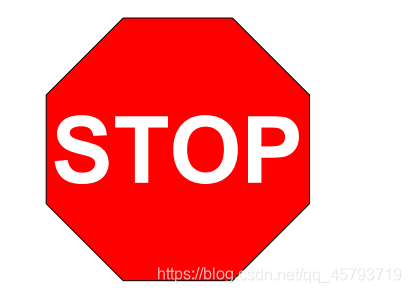
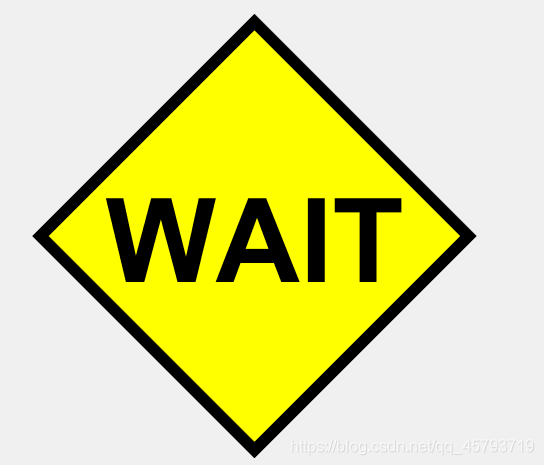
1.8
- fill()
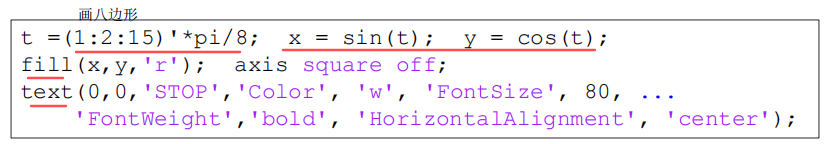
t=linspace(0,2*pi,5);
x=sin(t);
y=cos(t);
h=fill(x,y,‘y’);axis square off;
set(h,‘linewidth’,7);
text(0,0,‘WAIT’,‘Color’,‘k’,‘FontSize’,70,…
‘FontWeight’,‘bold’,‘HorizontalAlignment’,‘center’);
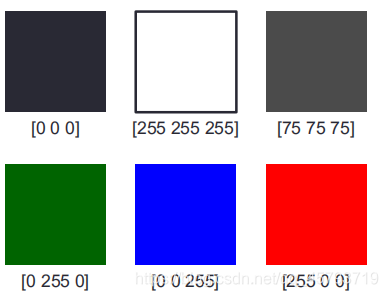
2.0
[R G B]
255对应FF
2.1
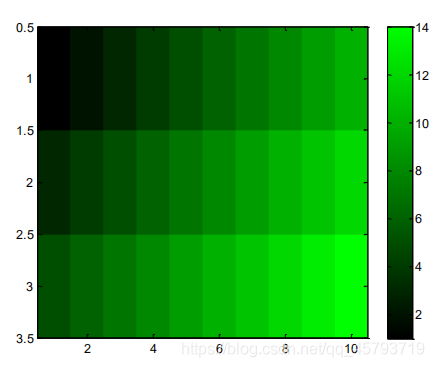
- imagesc( )用颜色表示数值
2.2
- colorbar()在坐标轴旁边显示一个颜色数值对应条
- colormap(Name) 改变数值对应的颜色
x=[1:10;3:12;5:14];
imagesc(x);
colorbar;
map=zeros(256,3);
map(:,2)=(0:255)/255;
colormap(map);
3.0
3.1
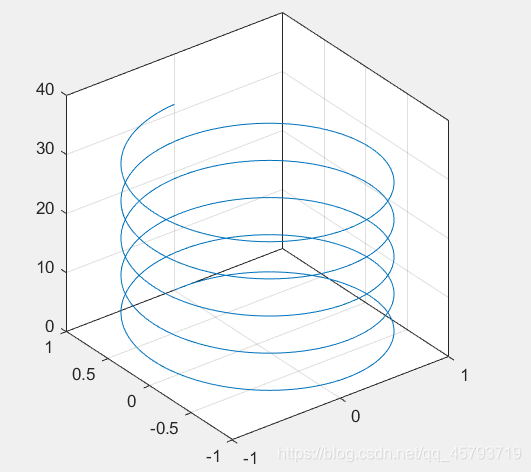
- plot3(x,y,z)
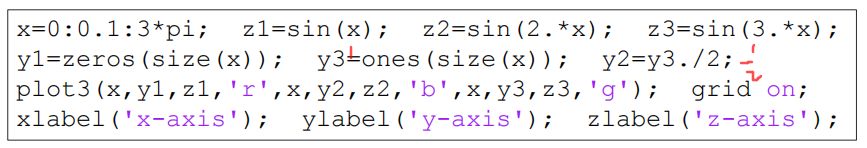
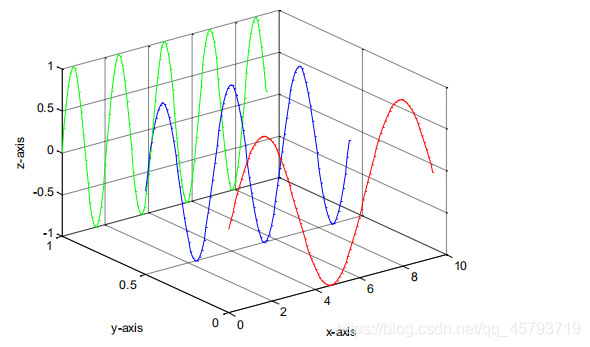
t=0:pi/50:10*pi;
plot3(sin(t),cos(t),t);
grid on;axis square;box on
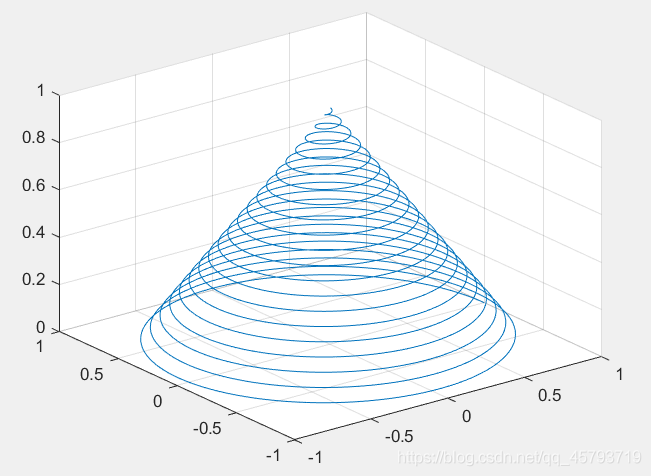
turns=40pi;
t=linspace(0,turns,4000);
x=cos(t).(turns-t)./turns;
y=sin(t).*(turns-t)./turns;
z=t./turns;
plot3(x,y,z);
grid on;
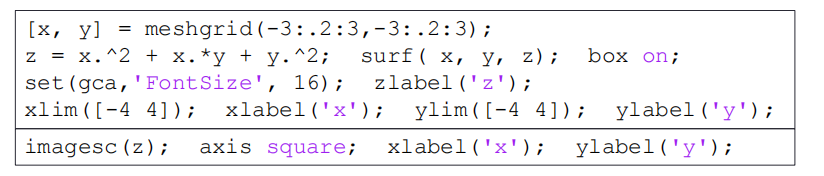
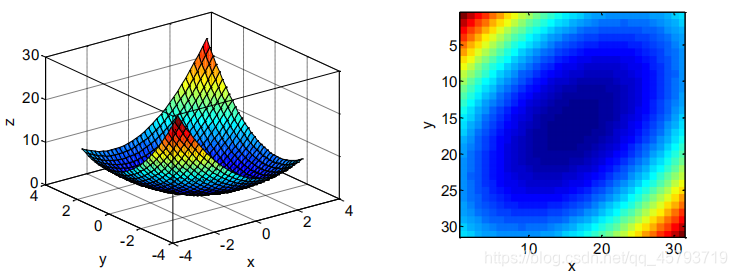
3.2
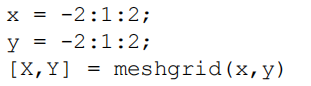
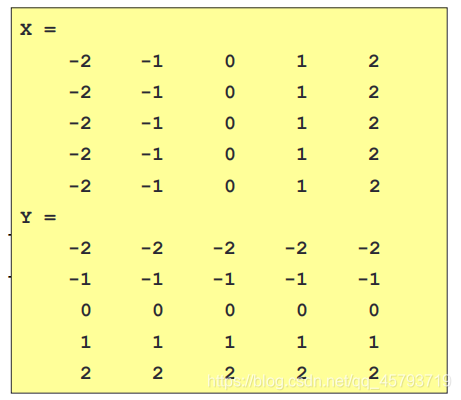
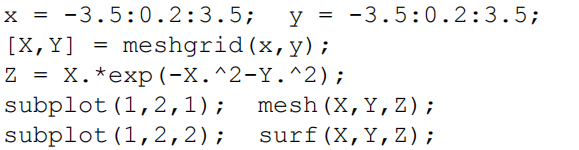
- [X,Y]=meshgrid(x,y) 使用这个函数可以得到两个有对应点的矩阵
3.3
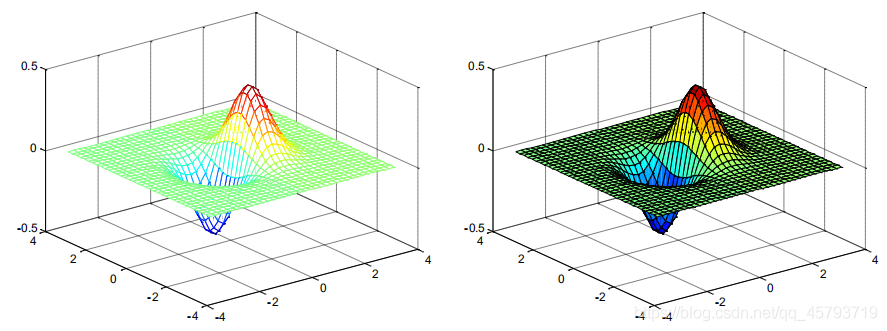
- mesh()没有小格子和surf()有小格子
3.4
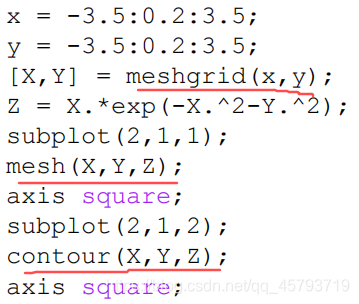
- contour()有点类似于投影,让3D变成2D
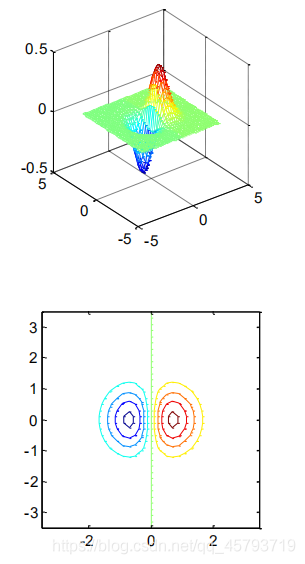
有一页看不懂
3.5
- meshc()和surfc()
- 3D加2D
3.6
- view(x,y)
- x,y是想看的角度
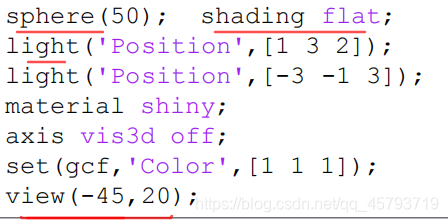
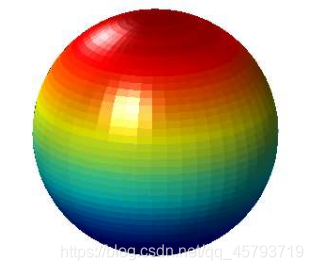
- [X,Y,Z]=sphere(30),其中参数30表示球面沿着经度、纬度方向被分成的面片数。
- shading 设置颜色着色属性
- shading flat 每个网格线段和面具有恒定颜色,该颜色由该线段的端点或该面的角边处具有最小索引的颜色值确定。
- material就是让做出的表面图有质地感,包括亮度,暗度,金属感等等。
- material SHINY makes the objects shiny.
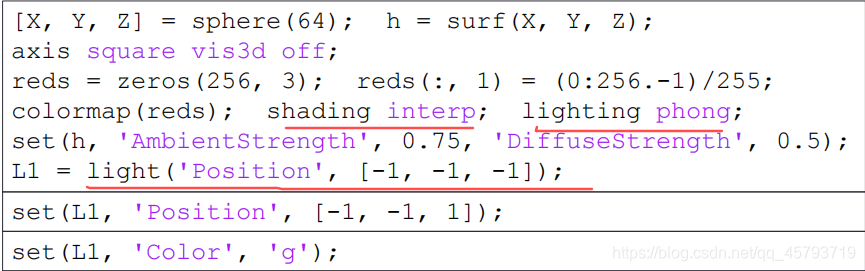
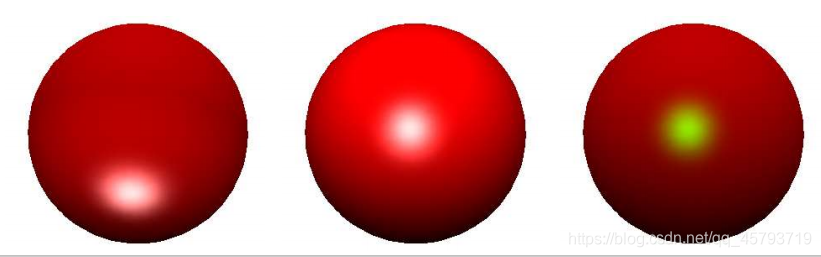
3.7
- light(‘position’,[ ])
- shading interp 通过在每个线条或面中对颜色图索引或真彩色值进行插值来改变该线条或面中的颜色。
3.8
- patch()画多边形