绘制三维图像
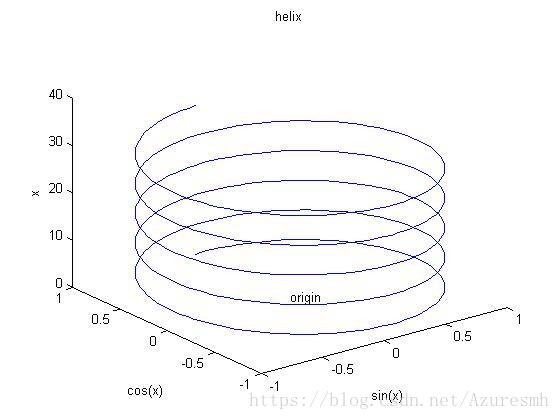
一、plot3函数
x=0:pi/50:10*pi;
sin=sin(x);
cos=cos(x);
plot3(sin,cos,x);
title(‘helix’),text(0,0,0,’origin’);
xlabel(‘sin(x)’),ylabel(‘cos(x)’),zlabel(‘x’)
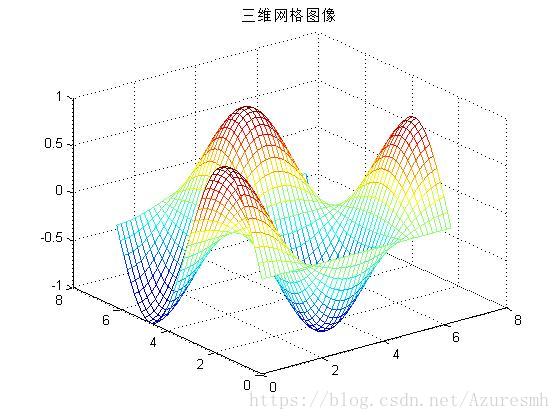
二、mesh函数
x=0:0.15:2*pi;
y=0:0.15:2*pi;
z=sin(y’)*cos(x);
mesh(x,y,z)
title(‘三维网格图像’)
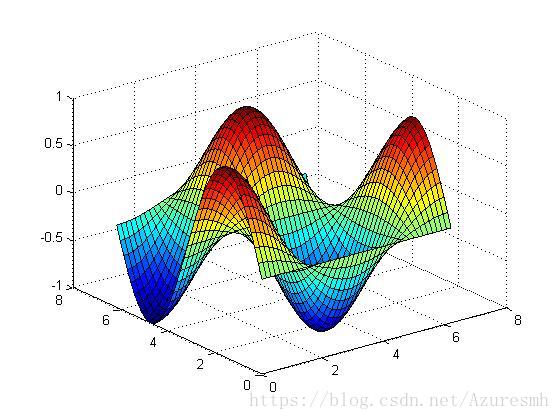
三、surf函数
x=0:0.15:2*pi;
y=0:0.15:2*pi;
z=sin(y’)*cos(x);
surf(x,y,z)
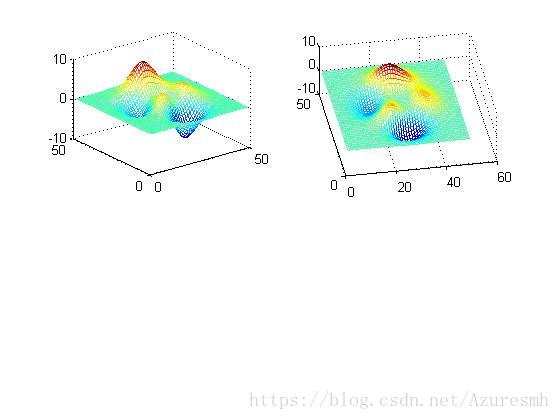
四、view视角函数
p=peaks;
subplot(2,2,1);
mesh(peaks,p);
view(-37.5,30);
subplot(2,2,2);
mesh(peaks,p);
view(-10,60);
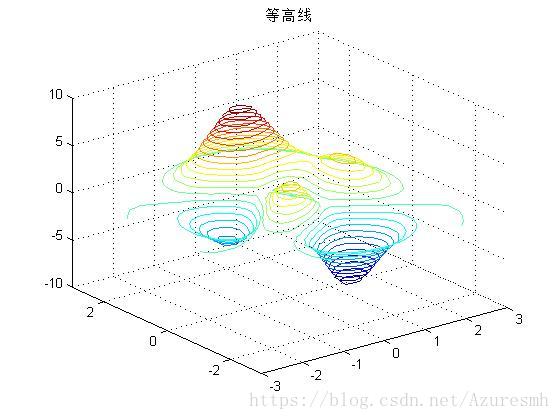
五、contour3等高线绘图
[x,y,z]=peaks(30);
contour3(x,y,z,8);
contour3(x,y,z,26);
title(‘等高线’);