这个单子分为三个界面,到头来我放弃做了,一个是因为我确实不能按他的要求完整的输出,一个是因为她说话太不客气了,一个礼拜就这个浪费了,还有一个是我吧要求理解错了,导致有点失误,说到底还是自己的错。水平不够,就要受罪。


# -*- coding:UTF-8 -*-
import tkinter as tk
from tkinter import ttk
from tkinter import filedialog
from tkinter import StringVar, IntVar
from tkinter import PhotoImage
from PIL import Image, ImageTk
from sklearn import metrics
import matplotlib.pyplot as plt
from sklearn.metrics import auc
from sklearn.metrics import classification_report
from __future__ import division
import numpy as np
from sklearn.svm import SVC
from sklearn.model_selection import GridSearchCV
import numpy as np
from sklearn.linear_model import LogisticRegression
import numpy as np
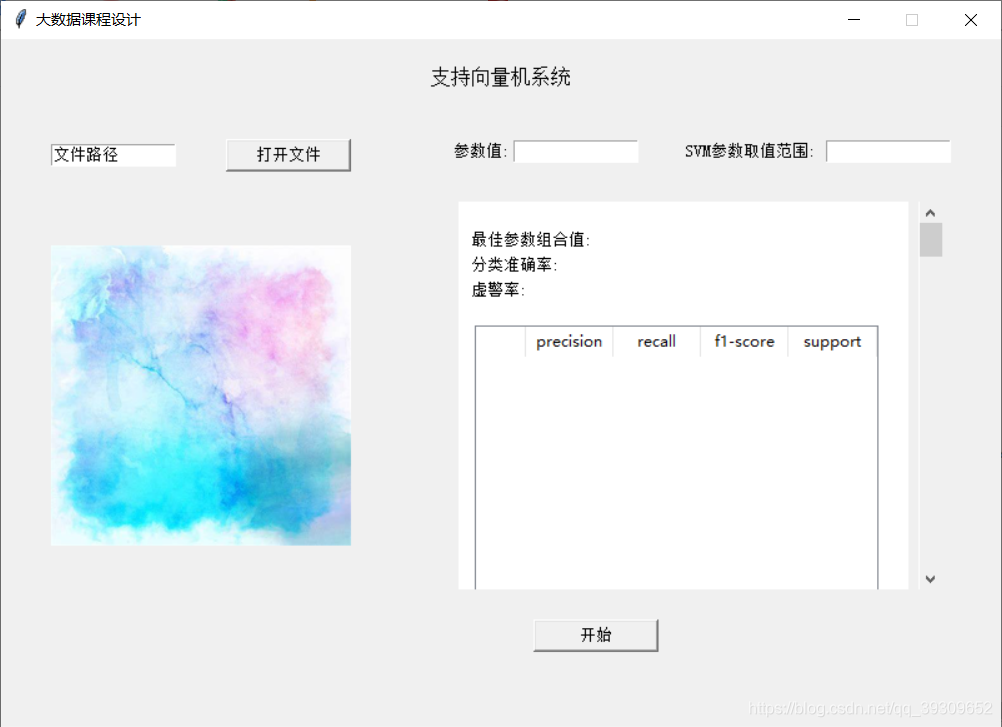
window = tk.Tk()
window.title('大数据课程设计')
window.geometry('800x550')
window.resizable(False, False)
window.iconbitmap() ## 图标
### -----数据------
filePath = '文件路径'
###------内容-------
### 标题
l = tk.Label(window, text = '支持向量机系统', font = ('宋体', 12))
l.place(x = 300, y = 20, width = 200, height = 20)
### ------左侧------
frm_l = tk.Frame(window)
frm_l.pack()
frm_l.place(x = 40, y = 80, width = 240, height = 400)
## 顶端
top_frm_l = tk.Frame(frm_l)
top_frm_l.pack()
top_frm_l.place(x = 0, y = 0, width = 240, height = 26)
### 文本框
text1 = tk.Entry(top_frm_l, font = ('宋体', 10))
text1.insert(0, filePath)
text1.pack()
text1.place(x = 0, y = 4, width = 100, height = 18)
### 浏览文件按钮
def open_file():
# 调用askopenfilename方法获取单个打开的文件
filePath = filedialog.askopenfilename(title='打开文件',
filetypes=[("压缩文件", "*.npz"),("文本文件", "*.txt"), ('Python源文件', '*.py')],
initialdir='./') # 初始目录
text1.delete(0, tk.END)
text1.insert(0, filePath)
if text1.get() is not '':
imp = imgInp('./img/bg/train.png')
im_lab.config(image = imp)
im_lab.image = imp
btn = tk.Button(top_frm_l, text = '打开文件', font = ('宋体', 10), width = 10, height = 1, command = open_file)
btn.pack()
btn.place(x = 140, y = 0, width = 100, height = 26)
### 图片
def imgInp(imgpath):
im = Image.open(imgpath)
im = im.resize((240, int(240 / im.width * im.height)), Image.ANTIALIAS)
imp = ImageTk.PhotoImage(im)
return imp
imp = imgInp('./img/bg/bg.jpeg')
im_lab = tk.Label(frm_l, image = imp)
im_lab.pack()
im_lab.place(x = 0, y = 50, width = 240, height = 310)
### ------右侧------
frm_r = tk.Frame(window, bd = 0)
frm_r.pack()
frm_r.place(x = 360, y = 80, width = 400, height = 420)
### top
top_frm_r = tk.Frame(frm_r, bd = 0)
top_frm_r.pack()
top_frm_r.place(x = 0, y = 0, width = 400, height = 20)
### 文本框 右1
Lab_r1 = tk.Label(top_frm_r, text = '参数值:', font = ('宋体', 10))
Lab_r1.pack()
Lab_r1.place(x = 0, y = 0, width = 50, height = 20)
Tex_r1 = tk.Entry(top_frm_r, font = ('宋体', 10))
Tex_r1.pack()
Tex_r1.place(x = 50, y = 1, width = 100, height = 18)
### 文本框 右2
Lab_r2 = tk.Label(top_frm_r, text = 'SVM参数取值范围:', font = ('宋体', 10))
Lab_r2.pack()
Lab_r2.place(x = 180, y = 0, width = 120, height = 20)
Tex_r2 = tk.Entry(top_frm_r, font = ('宋体', 10))
Tex_r2.pack()
Tex_r2.place(x = 300, y = 1, width = 100, height = 18)
### 显示区
canvas = tk.Canvas(frm_r, width = 360, height = 310, bd = 0, bg = 'white', scrollregion = (0, 0, 0, 3200), highlightthickness=0, relief='ridge')
canvas.delete("all")
vbar = tk.Scrollbar(frm_r, orient = "vertical", bd = 0) #竖直滚动条
vbar.pack()
vbar.place(x = 374, y = 50, width = 20, height = 310)
vbar.configure(command = canvas.yview)
canvas.config(yscrollcommand = vbar.set) #设置
Tex_rm1 = tk.Label(canvas, bg = "white", text = '最佳参数组合值:', font = ('宋体', 10), width = 60, anchor = "w")
Tex_rm2 = tk.Label(canvas, bg = "white", text = '分类准确率:', font = ('宋体', 10), width = 40, anchor = "w")
Tex_rm3 = tk.Label(canvas, bg = "white", text = '虚警率:', font = ('宋体', 10), width = 40, anchor = "w")
canvas.create_window((220, 30), window = Tex_rm1)
canvas.create_window((150, 50), window = Tex_rm2)
canvas.create_window((150, 70), window = Tex_rm3)
### 表格
columns = ("num", "precision", "recall", "f1-score", "support")
treeview = ttk.Treeview(canvas, height = 10, show = 'headings', columns = columns, selectmode = 'none')
treeview.column("num", width = 40, anchor = 'center')
treeview.column("precision", width = 70, anchor = 'center')
treeview.column("recall", width = 70, anchor = 'center')
treeview.column("f1-score", width = 70, anchor = 'center')
treeview.column("support", width = 70, anchor = 'center')
treeview.heading("num", text = "")
treeview.heading("precision", text = "precision")
treeview.heading("recall", text = "recall")
treeview.heading("f1-score", text = "f1-score")
treeview.heading("support", text = "support")
canvas.create_window((174, 212), window = treeview)
def dispResult_data(dispRes, precision, recall, f1_score, support):
### 结果显示
Tex_rm1.config(text = '最佳参数组合值:' + str(dispRes[0]) + ' & ' + str(dispRes[1]))
Tex_rm2.config(text = '分类准确率:' + str(dispRes[2]))
Tex_rm3.config(text = '虚警率:' + str(dispRes[3]))
### 表格数据填充
x = treeview.get_children()
for item in x:
treeview.delete(item)
for i in range(len(precision)):
treeview.insert('', i, values=(i, precision[i], recall[i], f1_score[i], support[i]))
### 图片显示
def dispResult_img(infile):
root_path = './img/'
global p
p = []
for j in range(len(infile) - 5):
img = Image.open(root_path + str(j) + '.png')
graph = img.resize((320, int(320 / img.width * img.height)), Image.ANTIALIAS)
p.append(ImageTk.PhotoImage(graph))
for i in range(5, len(infile)):
title_img = tk.Label(canvas, bg = "white", text = "第" + str(int(infile[i][0])) + "类AUC的值为" + str(infile[i][1]), font = ('宋体', 10), width = 40, anchor = "w")
offset = 270 * (i - 5)
canvas.create_window((160, 340 + offset), window = title_img)
canvas.create_window((178, 480 + offset), window = tk.Label(canvas, image = p[i - 5]))
### bottom
bot_frm_r = tk.Frame(frm_r)
bot_frm_r.pack()
bot_frm_r.place(x = 0, y = 384, width = 400, height = 26)
def analysis(path, paraA, paraB): ## 分析程序
print("第163行 调用分析程序 ++++ ++ + " + path + " & " + str(paraA) + " & " + str(paraB))
#!/usr/bin/env python
# coding: utf-8
# In[1]:
#进行数据的获取
f = np.load('./mnist.npz')
#划分训练集和测试集
X_train , y_train = f['x_train'][:100], f['y_train'][:100]
X_test , y_test = f['x_test'][:100], f['y_test'][:100]
#将数据转化格式为float32
X_train = X_train.astype('float32')
X_test = X_test.astype('float32')
# In[4]:
#红绿蓝三色在计算机中只分配了一个字节,一个字节有八位,每一位只能储存1或0,计算机只懂二进制,所以就是2的八次方
X_train /= 255.
X_test /= 255.
#进行维度转化
# In[5]:
X_train.shape
# In[6]:
X_test.shape
# In[7]:
X_train = X_train.reshape(100,784)
X_test = X_test.reshape(100,784)
# In[8]:
X_train.shape
# In[9]:
cs = np.linspace(1,2,)
gammas=np.linspace(0,1,)
# Set the parameters by cross-validation
param_grid = {'C': cs,'gamma':gammas}
clf = GridSearchCV(SVC(kernel='rbf'), param_grid, cv=5, return_train_score=True)
clf.fit(X_train,y_train)
print("best param: {0}\nbest score: {1}".format(clf.best_params_, clf.best_score_))
# In[10]:
#!/usr/bin/env python2
# -*- coding: utf-8 -*-
def lossAndGradNaive(X,Y,W,reg):
dW=np.zeros(W.shape)
loss = 0.0
num_class=W.shape[0]
num_X=X.shape[0]
for i in range(num_X):
scores=np.dot(W,X[i])
cur_scores=scores[int(Y[i])]
for j in range(num_class):
if j==Y[i]:
continue
margin=scores[j]-cur_scores+1
if margin>0:
loss+=margin
dW[j,:]+=X[i]
dW[int(Y[i]),:]-=X[i]
loss/=num_X
dW/=num_X
loss+=reg*np.sum(W*W)
dW+=2*reg*W
return loss,dW
def lossAndGradVector(X,Y,W,reg):
dW=np.zeros(W.shape)
N=X.shape[0]
Y_=X.dot(W.T)
margin=Y_-Y_[range(N),Y.astype(int)].reshape([-1,1])+1.0
margin[range(N),Y.astype(int)]=0.0
margin=(margin>0)*margin
loss=0.0
loss+=np.sum(margin)/N
loss+=reg*np.sum(W*W)
"""For one data,the X[Y[i]] has to be substracted several times"""
countsX=(margin>0).astype(int)
countsX[range(N),Y.astype(int)]=-np.sum(countsX,axis=1)
dW+=np.dot(countsX.T,X)/N+2*reg*W
return loss,dW
def predict(X,W):
X=np.hstack([X, np.ones((X.shape[0], 1))])
Y_=np.dot(X,W.T)
Y_pre=np.argmax(Y_,axis=1)
return Y_pre
def accuracy(X,Y,W):
Y_pre=predict(X,W)
acc=(Y_pre==Y).mean()
return acc
def model(X,Y,alpha,steps,reg):
X=np.hstack([X, np.ones((X.shape[0], 1))])
W = np.random.randn(10,X.shape[1]) * 0.0001
for step in range(steps):
loss,grad=lossAndGradNaive(X,Y,W,reg)
W-=alpha*grad
print("The {} step, loss={}, accuracy={}".format(step,loss,accuracy(X[:,:-1],Y,W)))
return W
# train_data,train_label,test_data,test_label=load_data(0.2)
W=model(X_train,y_train,0.04081632653061224,25,int(paraA))
print("Test accuracy of the model is {}".format(accuracy(X_test,y_test,W)))
# In[11]:
print("虚警率{}".format(1-accuracy(X_test,y_test,W)))
# In[12]:
a=classification_report(y_test,predict(X_test,W))
# In[81]:
### 数据保存
import pandas as pd
saveDatas = []
best = []
best.append(clf.best_params_['C'])
best.append(clf.best_params_['gamma'])
best.append(clf.best_score_)
best.append(1-accuracy(X_test,y_test,W))
saveDatas.append(best)
def classifaction_report_txt(report):
precision = []
recall = []
f1_score = []
support = []
lines = report.split('\n')
for line in lines[2 : -5]:
row_data = line.split()
precision.append(float(row_data[1]))
recall.append(float(row_data[2]))
f1_score.append(float(row_data[3]))
support.append(float(row_data[4]))
saveDatas.append(precision)
saveDatas.append(recall)
saveDatas.append(f1_score)
saveDatas.append(support)
classifaction_report_txt(a)
# In[14]:
# 精确度=TT/(TT+TF)--判断正样本中真正正样本的比例
# 准确率=(TT+FF)/(T+F)--判断正确的比重
# 召回率=TT/(TT+FT)--正确判断正例的比重
# 漏报率=FT/(TT+FT)--多少个正例被漏判了
# 虚警率=TF/(TT+TF)--反映被判为正例样本中,有多少个是负例
# In[18]:
### 结果保存
print(a)
# In[83]:
for i in range(10):
fpr, tpr, thresholds=metrics.roc_curve(y_test,predict(X_test,W),pos_label=i,sample_weight=None,drop_intermediate=True)
auc = metrics.auc(fpr, tpr)
print('第{0}类AUC的值为{1}'.format(i,auc))
cache = []
cache.append(i)
cache.append(auc)
saveDatas.append(cache)
plt.plot(fpr,tpr,marker = 'o')
plt.savefig("./img/" + str(i) + ".png")
# plt.show()
# In[86]:
np.savetxt('./data/datas.txt', saveDatas, fmt = '%s')
# In[ ]:
def analysisCheck():
filePath = text1.get()
if (filePath is not '文件路径') & (str(Tex_r1.get()).isdigit()) & (str(Tex_r2.get()).isdigit()):
analysis(filePath, Tex_r1.get(), Tex_r2.get())
loadResult()
def loadData(infile): ### 加载数据
f = open(infile, 'r')
sourceInLine = f.readlines()
dataset = []
for line in sourceInLine:
temp1 = line.strip('\n')
temp2 = temp1.replace('[', '')
temp2 = temp2.replace(']', '')
temp3 = temp2.split(',')
dataset.append(temp3)
for i in range(len(dataset)):
for j in range(len(dataset[i])):
dataset[i][j] = float(dataset[i][j])
return dataset
def loadResult():
infile = './data/datas.txt'
infile = loadData(infile)
dispResult_data(infile[0], infile[1], infile[2], infile[3], infile[4])
dispResult_img(infile)
btn_rb1 = tk.Button(bot_frm_r, text = '开始', font = ('宋体', 10), width = 10, height = 1, command = analysisCheck)
# btn_rb2 = tk.Button(bot_frm_r, text = '保存', font = ('宋体', 10), width = 10, height = 1)
btn_rb1.pack()
btn_rb1.pack()
btn_rb1.place(x = 66, y = 0, width = 100, height = 26)
# btn_rb2.place(x = 232, y = 0, width = 100, height = 26)
canvas.pack()
canvas.place(x = 6, y = 50)
window.mainloop()
第163行 调用分析程序 ++++ ++ + C:/Users/Administrator/Desktop/demo/demo2/mnist.npz & 2 & 10
best param: {'C': 1.4489795918367347, 'gamma': 0.02040816326530612}
best score: 0.84
The 24 step, loss=3.9451338723169567, accuracy=0.85
Test accuracy of the model is 0.65
虚警率0.35


D:\sofewore\anaconda\lib\site-packages\sklearn\metrics\classification.py:1135: UndefinedMetricWarning: Precision and F-score are ill-defined and being set to 0.0 in labels with no predicted samples.
  'precision', 'predicted', average, warn_for)


             precision    recall  f1-score   support

          0       1.00      0.75      0.86         8
          1       1.00      0.64      0.78        14
          2       0.71      0.62      0.67         8
          3       0.38      0.91      0.54        11
          4       1.00      0.57      0.73        14
          5       0.00      0.00      0.00         7
          6       0.70      0.70      0.70        10
          7       0.75      0.80      0.77        15
          8       0.00      0.00      0.00         2
          9       0.44      0.73      0.55        11

avg / total       0.69      0.65      0.64       100

第0类AUC的值为0.14673913043478262
第1类AUC的值为0.1424418604651163
第2类AUC的值为0.2778532608695652
第3类AUC的值为0.388661899897855
第4类AUC的值为0.6710963455149501
第5类AUC的值为0.4646697388632872
第6类AUC的值为0.6227777777777778
第7类AUC的值为0.7345098039215687
第8类AUC的值为0.548469387755102
第9类AUC的值为0.8687436159346272
