import pandas as pd
#参考网站
#https://mp.weixin.qq.com/s/ztm9-LoPic2etFDGB95jmQ
test=pd.read_excel('products_data.xls')
test.head()
| 店铺名称 | 商品信息 | 销售价格 | 付款人数 | 发货地 | |
|---|---|---|---|---|---|
| 0 | 坤穹运动户外专营店 | 斯蒂卡乒乓球拍黑檀7 专业级球拍进攻型纯木黑檀5枫木7斯帝卡底板 | ¥1048.00 | 38人付款 | 河北 石家庄 |
| 1 | 米力运动专营店 | 蝴蝶乒乓球拍蝴蝶王单拍专业级8星碳素底板八星兵乓横拍正品直拍 | ¥478.00 | 114人付款 | 上海 |
| 2 | luciferchen123 | 莹恋STIGA斯帝卡斯蒂卡 蓝标许昕碳素王朝乒乓球底板球拍DYNASTY | ¥1074.40 | 25人付款 | 北京 |
| 3 | 圣浓运动专营店 | STIGA斯帝卡碳素王朝斯蒂卡DYNASTY CARBON乒乓球拍底板许昕蓝标 | ¥1106.00 | 1人付款 | 浙江 金华 |
| 4 | luciferchen123 | 莹恋红双喜乒乓球底板球拍新版狂飙龙5X龙五狂飙龙2狂飚龙3三马龙 | ¥797.00 | 58人付款 | 北京 |
数据预处理
test.info()
<class 'pandas.core.frame.DataFrame'>
RangeIndex: 1062 entries, 0 to 1061
Data columns (total 5 columns):
店铺名称    1062 non-null object
商品信息    1062 non-null object
销售价格    1062 non-null object
付款人数    1062 non-null object
发货地     1062 non-null object
dtypes: object(5)
memory usage: 41.6+ KB
test.isnull().sum()
店铺名称    0
商品信息    0
销售价格    0
付款人数    0
发货地     0
dtype: int64
test['销售价格']=test['销售价格'].apply(lambda x: x.split('¥')[1])
test['付款人数']=test['付款人数'].apply(lambda x: x.split('人')[0])
test['销售价格']=test['销售价格'].astype('float')
test['付款人数']=test['付款人数'].astype('int')
import codecs
import jieba
import pickle
# test['商品信息'].to_csv('名称.txt', sep='\t', index=False)
# fin = codecs.open('名称.txt',mode = 'r', encoding = 'utf-8')
# # print (fin.read())
# #第一次运行程序时将分好的词存入文件
# text = ''
# with open('名称.txt',encoding = 'utf-8') as fin:
#     for line in fin.readlines():
#         line = line.strip('\n')
#         text += ' '.join(jieba.cut(line))
#         text += ' '
# fout = open('text.txt','wb')
# pickle.dump(text,fout)
# fout.close()
import matplotlib.pyplot as plt
%matplotlib inline
from wordcloud import WordCloud,STOPWORDS,ImageColorGenerator
fr = open('text.txt','rb')
text = pickle.load(fr)
# print(text)
backgroud_Image = plt.imread('table_tennis.jpg')
wc = WordCloud( background_color = 'white',    # 设置背景颜色
                mask = backgroud_Image,        # 设置背景图片
                max_words = 200,            # 设置最大现实的字数
                stopwords = STOPWORDS,        # 设置停用词
                font_path = 'simfang.ttf',# 设置字体格式,如不设置显示不了中文
                max_font_size = 200,            # 设置字体最大值
                random_state = 8,            # 设置有多少种随机生成状态,即有多少种配色方案
                )
wc.generate(text)
image_colors = ImageColorGenerator(backgroud_Image)
wc.recolor(color_func = image_colors)
plt.figure(figsize=(10,10))
plt.imshow(wc)
plt.axis('off')
plt.show()

# 2、将地区转化为只包含省
raw_location = test['发货地'].values
new_location = []
for location in raw_location:
    if ' ' in location:
        location = location[:location.find(' ')]
    new_location.append(location)
# df.location与df[location]效果类似
test['发货地'] = new_location
print(test['发货地'].values)
['河北' '上海' '北京' ... '河南' '河南' '北京']
test.head()
| 店铺名称 | 商品信息 | 销售价格 | 付款人数 | 发货地 | |
|---|---|---|---|---|---|
| 0 | 坤穹运动户外专营店 | 斯蒂卡乒乓球拍黑檀7 专业级球拍进攻型纯木黑檀5枫木7斯帝卡底板 | 1048.0 | 38 | 河北 |
| 1 | 米力运动专营店 | 蝴蝶乒乓球拍蝴蝶王单拍专业级8星碳素底板八星兵乓横拍正品直拍 | 478.0 | 114 | 上海 |
| 2 | luciferchen123 | 莹恋STIGA斯帝卡斯蒂卡 蓝标许昕碳素王朝乒乓球底板球拍DYNASTY | 1074.4 | 25 | 北京 |
| 3 | 圣浓运动专营店 | STIGA斯帝卡碳素王朝斯蒂卡DYNASTY CARBON乒乓球拍底板许昕蓝标 | 1106.0 | 1 | 浙江 |
| 4 | luciferchen123 | 莹恋红双喜乒乓球底板球拍新版狂飙龙5X龙五狂飙龙2狂飚龙3三马龙 | 797.0 | 58 | 北京 |
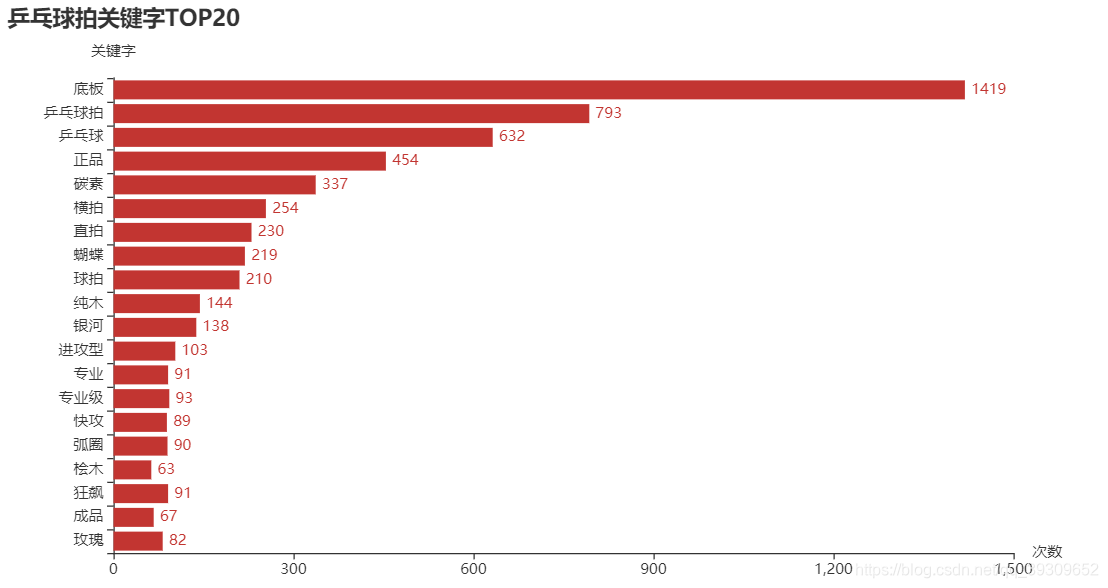
分析乒乓球拍标题高频关键字与商品数量关系
import jieba.analyse
keywords_count_list = jieba.analyse.textrank(' '.join(test['商品信息']), topK=50, withWeight=True)
Building prefix dict from the default dictionary ...
Loading model from cache C:\Users\ADMINI~1\AppData\Local\Temp\jieba.cache
Loading model cost 0.890 seconds.
Prefix dict has been built succesfully.
keywords_count_dict = {i[0]: 0 for i in reversed(keywords_count_list[:20])}
cut_words = jieba.cut(' '.join(test['商品信息']))
for word in cut_words:
    for keyword in keywords_count_dict.keys():
        if word == keyword:
            keywords_count_dict[keyword] = keywords_count_dict[keyword] + 1
print(keywords_count_dict)
{'玫瑰': 82, '成品': 67, '狂飙': 91, '桧木': 63, '弧圈': 90, '快攻': 89, '专业级': 93, '专业': 91, '进攻型': 103, '银河': 138, '纯木': 144, '球拍': 210, '蝴蝶': 219, '直拍': 230, '横拍': 254, '碳素': 337, '正品': 454, '乒乓球': 632, '乒乓球拍': 793, '底板': 1419}
from pyecharts.charts import Pie, Bar, Map, WordCloud
from pyecharts import options as opts
keywords_count_bar = (
        Bar()
            .add_xaxis(list(keywords_count_dict.keys()))
            .add_yaxis("", list(keywords_count_dict.values()))
            .reversal_axis()
            .set_series_opts(label_opts=opts.LabelOpts(position="right"))
            .set_global_opts(
            title_opts=opts.TitleOpts(title="乒乓球拍关键字TOP20"),
            yaxis_opts=opts.AxisOpts(name="关键字"),
            xaxis_opts=opts.AxisOpts(name="次数")
        )
    )
keywords_count_bar.render_notebook()
<div id="a79de72ca6bf4395a81e892dd7bd0f15" style="width:900px; height:500px;"></div>
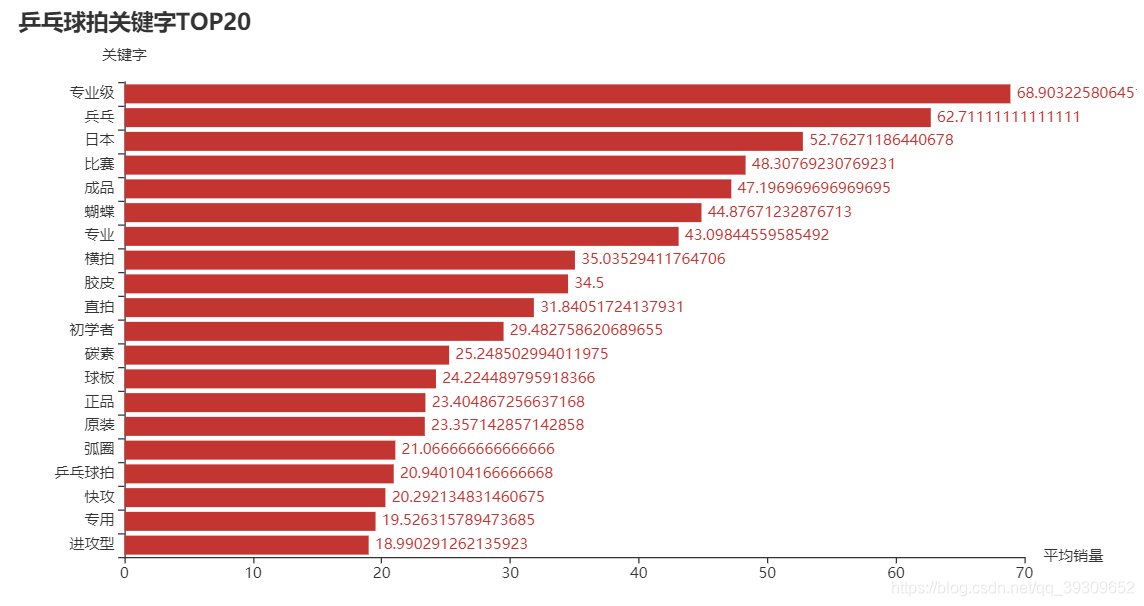
分析乒乓球拍标题与平均销量关系
def analysis_title_keywords(keywords_count_list, column, top_num) -> dict:
    """
    分析标题关键字与其他属性的关系
    :param keywords_count_list: 关键字列表
    :param column: 需要分析的属性名
    :param top_num: 截取前多少个
    :return:
    """
    # 1、获取高频词,生成一个dict={'keyword1':[], 'keyword2':[],...}
    keywords_column_dict = {i[0]: [] for i in keywords_count_list}
    for row in test.iterrows():
        for keyword in keywords_column_dict.keys():
            if keyword in row[1]['商品信息']:
                # 2、 将标题包含关键字的属性值放在列表中,dict={'keyword1':[属性值1,属性值2,..]}
                keywords_column_dict[keyword].append(row[1][column])
    # 3、 求属性值的平均值,dict={'keyword1':平均值1, 'keyword2',平均值2}
    for keyword in keywords_column_dict.keys():
        keyword_column_list = keywords_column_dict[keyword]
        keywords_column_dict[keyword] = sum(keyword_column_list) / len(keyword_column_list)
    # 4、 根据平均值排序,从小到大
    keywords_price_dict = dict(sorted(keywords_column_dict.items(), key=lambda d: d[1]))
    # 5、截取平均值最高的20个关键字
    keywords_price_dict = {k: keywords_price_dict[k] for k in list(keywords_price_dict.keys())[-top_num:]}
#     print(keywords_price_dict)
    return keywords_price_dict
keywords_sales_dict = analysis_title_keywords(keywords_count_list, '付款人数', 20)
    # 生成柱状图
keywords_sales_bar = (
    Bar()
        .add_xaxis(list(keywords_sales_dict.keys()))
        .add_yaxis("", list(keywords_sales_dict.values()))
        .reversal_axis()
        .set_series_opts(label_opts=opts.LabelOpts(position="right"))
        .set_global_opts(
        title_opts=opts.TitleOpts(title="乒乓球拍关键字TOP20"),
        yaxis_opts=opts.AxisOpts(name="关键字"),
        xaxis_opts=opts.AxisOpts(name="平均销量")
    )
)
keywords_sales_bar.render_notebook()
<div id="637cf0a54fbe47198db24d37829cb88d" style="width:900px; height:500px;"></div>
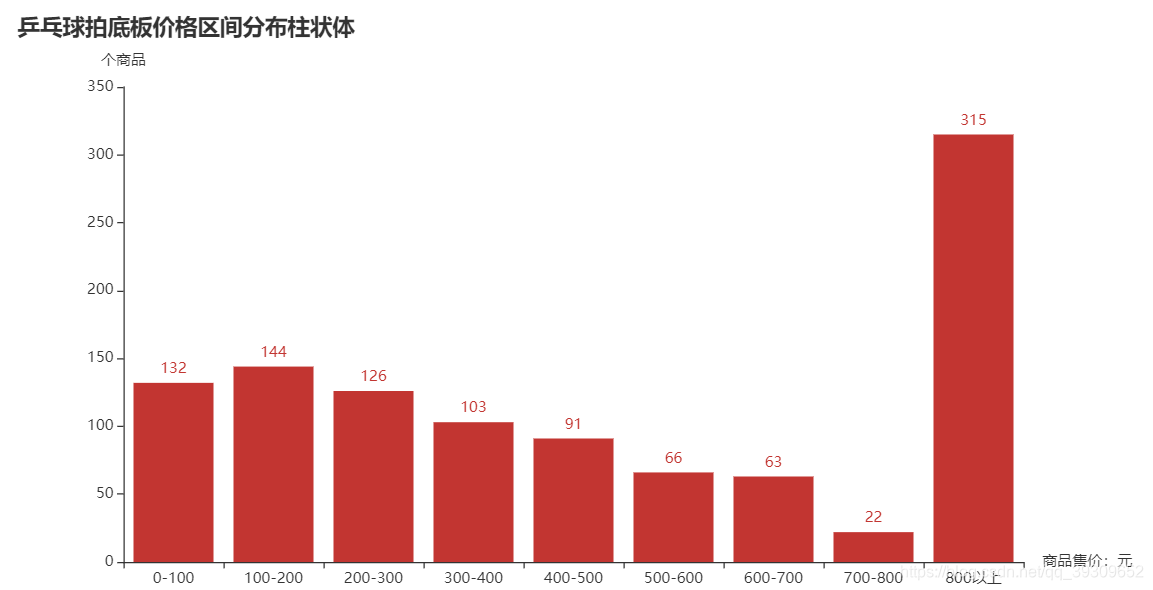
分析乒乓球拍底板商品价格区间分布关系
def cut_and_sort_data(listBins, listLabels, data_list) -> dict:
    """
    统计list中的元素个数,返回元素和count
    :param listBins: 数据切分区域
    :param listLabels: 切分后对应标签
    :param data_list: 数据列表形式
    :return: key为元素value为count的dict
    """
    data_labels_list = pd.cut(data_list, bins=listBins, labels=listLabels, include_lowest=True)
    # 生成一个以listLabels为顺序的字典,这样就不需要后面重新排序
    data_count = {i: 0 for i in listLabels}
    # 统计结果
    for value in data_labels_list:
        # get(value, num)函数的作用是获取字典中value对应的键值, num=0指示初始值大小。
        data_count[value] = data_count.get(value) + 1
    return data_count
price_list_bins = [0, 100, 200, 300, 400, 500, 600, 700, 800,1000000]
# 设置切分后对应标签
price_list_labels = ['0-100', '100-200', '200-300', '300-400', '400-500', '500-600', '600-700', '700-800', '800以上']
# 分区统计
price_count = cut_and_sort_data(price_list_bins, price_list_labels, test['销售价格'])
print(price_count)
# 生成柱状图
bar = (
    Bar()
        .add_xaxis(list(price_count.keys()))
        .add_yaxis("", list(price_count.values()))
        .set_global_opts(
        title_opts=opts.TitleOpts(title="乒乓球拍底板价格区间分布柱状体"),
        yaxis_opts=opts.AxisOpts(name="个商品"),
        xaxis_opts=opts.AxisOpts(name="商品售价:元")
    )
)
bar.render_notebook()
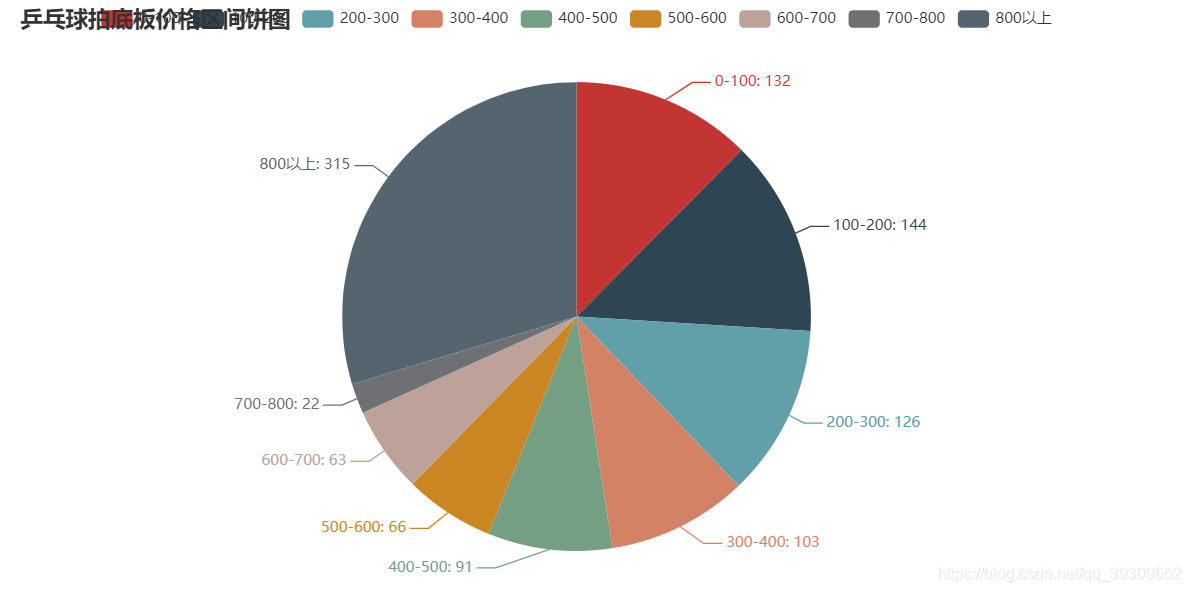
{'0-100': 132, '100-200': 144, '200-300': 126, '300-400': 103, '400-500': 91, '500-600': 66, '600-700': 63, '700-800': 22, '800以上': 315}
<div id="6c419d06e2ef4e3ba7c8f0875edeb484" style="width:900px; height:500px;"></div>
# 生成饼图
age_count_list = [list(z) for z in zip(price_count.keys(), price_count.values())]
pie = (
    Pie()
        .add("", age_count_list)
        .set_global_opts(title_opts=opts.TitleOpts(title="乒乓球拍底板价格区间饼图"))
        .set_series_opts(label_opts=opts.LabelOpts(formatter="{b}: {c}"))
)
pie.render_notebook()
<div id="8ebf790e6e944e62959bf5470be0d4a3" style="width:900px; height:500px;"></div>
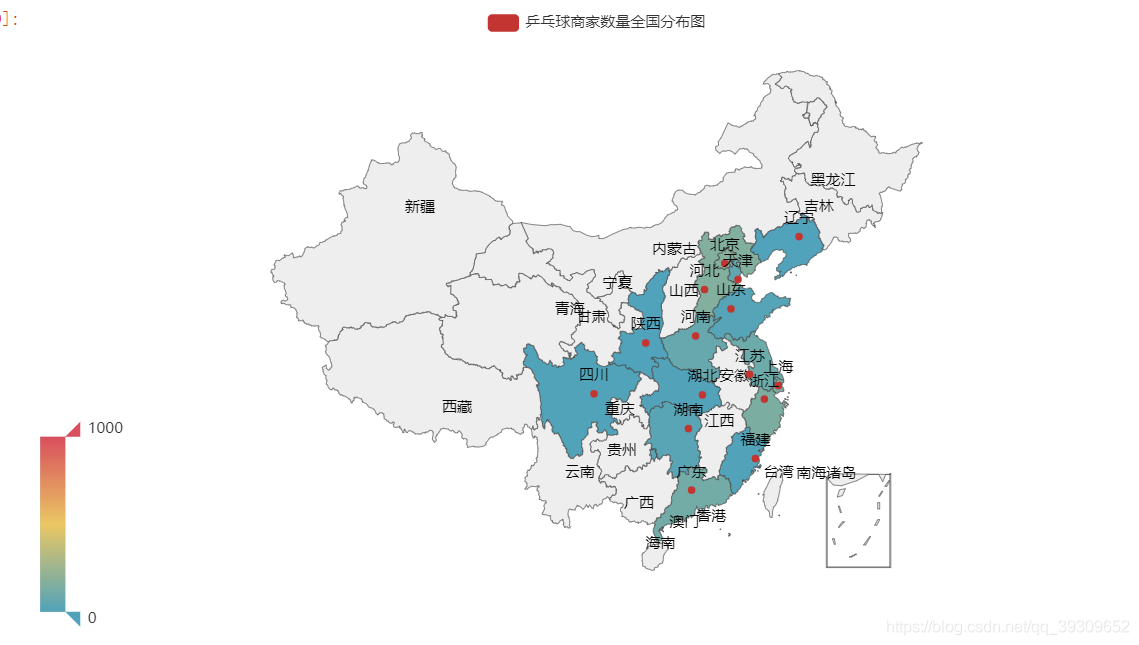
分析乒乓球商家数量全国分布关系
province_sales = test['发货地'].value_counts()
province_sales_list = [list(item) for item in province_sales.items()]
print(province_sales_list)
# 1.1 生成热力图
province_sales_map = (
    Map()
        .add("乒乓球商家数量全国分布图", province_sales_list, "china")
        .set_global_opts(
        visualmap_opts=opts.VisualMapOpts(max_=1000),
    )
)
province_sales_map.render_notebook()
[['北京', 178], ['河北', 162], ['上海', 152], ['浙江', 141], ['广东', 115], ['江苏', 93], ['河南', 70], ['天津', 57], ['湖南', 31], ['日本', 25], ['山东', 18], ['福建', 6], ['湖北', 5], ['海外', 4], ['四川', 3], ['陕西', 1], ['辽宁', 1]]
<div id="372c40b6b1814216b67e45775d988387" style="width:900px; height:500px;"></div>
# 1.2 生成柱状图
province_sales_bar = (
    Bar()
        .add_xaxis(province_sales.index.tolist())
        .add_yaxis("", province_sales.values.tolist(), category_gap="50%")
        .set_global_opts(
        title_opts=opts.TitleOpts(title="乒乓球商家数量地区柱状图"),
        yaxis_opts=opts.AxisOpts(name="商家数量"),
        xaxis_opts=opts.AxisOpts(name="地区", axislabel_opts={"rotate": 90})
    )
)
province_sales_bar.render_notebook()
<div id="2853305a414a4176b2f2e8ec08dacd10" style="width:900px; height:500px;"></div>
