这个小网格图,是对各种图像都适用,
- 主要是sns.FacetGrid对横纵分类的标准选择
- g.map(plt.scatter, “total_bill”, “tip”, edgecolor=“w”)对单个图像横纵坐标的标识
代码:
import seaborn as sns
sns.set(style="ticks", color_codes=True)
import matplotlib.pyplot as plt
#g = sns.FacetGrid(tips, col="time", row="smoker")
#g = g.map(plt.hist, "total_bill")
#
import numpy as np
tips = sns.load_dataset("tips")
bins = np.arange(0, 65, 5)
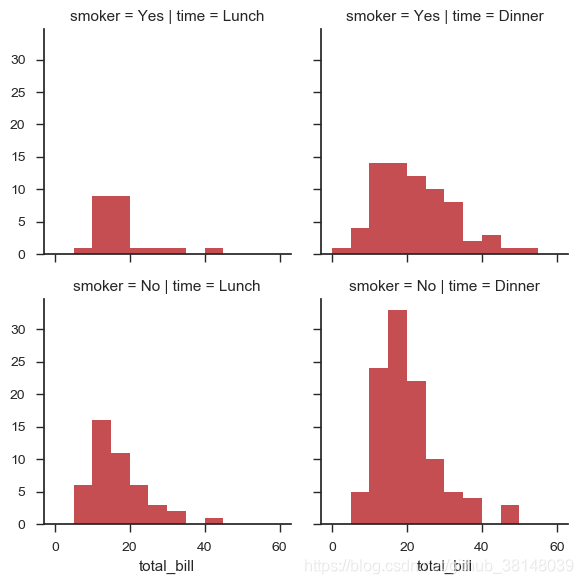
##这里的time 和 smoker 是指在图像行与行之间有什么差异,比如这里第一行是smoker,第二行是不抽烟
#g = sns.FacetGrid(tips, col="time", row="smoker")
##
#g = g.map(plt.hist, "total_bill", bins=bins, color="r")
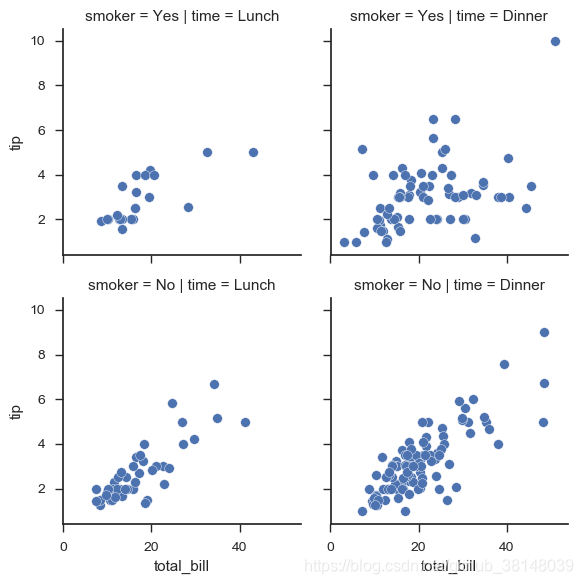
#g = sns.FacetGrid(tips, col="time", row="smoker")
#这里设置显示图片的横纵坐标
#g = g.map(plt.scatter, "total_bill", "tip", edgecolor="w")
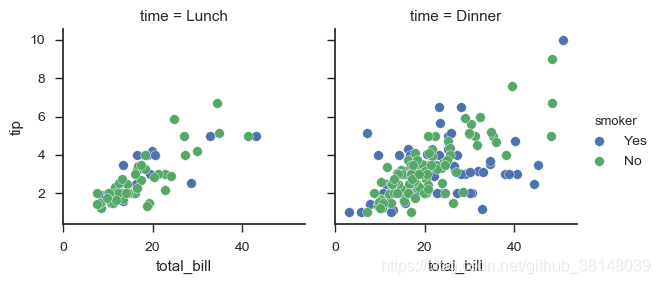
#g = sns.FacetGrid(tips, col="time", hue="smoker")
#g = (g.map(plt.scatter, "total_bill", "tip", edgecolor="w").add_legend())
#
#g = sns.FacetGrid(tips, col="day", height=4, aspect=.5)
#g = g.map(plt.hist, "total_bill", bins=bins)
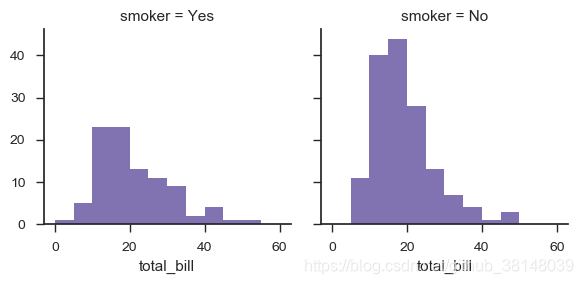
g = sns.FacetGrid(tips, col="smoker", col_order=["Yes", "No"])
g = g.map(plt.hist, "total_bill", bins=bins, color="m")
出图相关