3.1 使用图形
- plot:基础绘图
- abline:添加回归直线
- hist:绘制直方图
- boxplot:绘制箱线图
- dev.new():returns the return value of the device opened, usually invisible NULL.
- dev.cur(): returns a length-one named integer vector giving the number and name of the active device, or 1, the null device, if none is active.
- dev.list(): returns the numbers of all open devices, except device 1, the null device. This is a numeric vector with a names attribute giving the device names, or NULL is there is no open device.
- dev.next(which = dev.cur()):return the number and name of the next device in the list of devices. This will be the null device if and only if there are no open devices.
- dev.prev(which = dev.cur()): return the number and name of the previous device in the list of devices. This will be the null device if and only if there are no open devices.
- dev.off(which = dev.cur()): returns the number and name of the new active device (after the specified device has been shut down).
- dev.set(which = dev.next()): returns the number and name of the new active device.
- graphics.off()
Only one device is the ‘active’ device: this is the device in which all graphics operations occur. There is a "null device" which is always open but is really a placeholder: any attempt to use it will open a new device specified by getOption("device").
Devices are associated with a name (e.g., "X11" or "postscript") and a number in the range 1 to 63; the "null device" is always device 1. Once a device has been opened the null device is not considered as a possible active device. There is a list of open devices, and this is considered as a circular list not including the null device. dev.next and dev.prev select the next open device in the appropriate direction, unless no device is open.
3.2 一个简单的例子
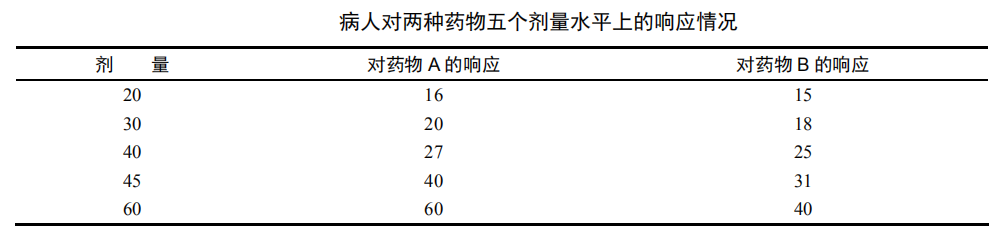
dose <- c(20, 30, 40, 45, 60)
drugA <- c(16, 20, 27, 40, 60)
drugB <- c(15, 18, 25, 31, 40)
plot(dose, drugA, type="b")

3.3 图形参数
- plot(x, y, ...): Generic function for plotting of R objects. For more details about the graphical parameter arguments, see par.
For simple scatter plots, plot.default will be used. However, there are plot methods for many R objects, including functions, data.frames, density objects, etc. Use methods(plot) and the documentation for these.