1、Prometheus简介
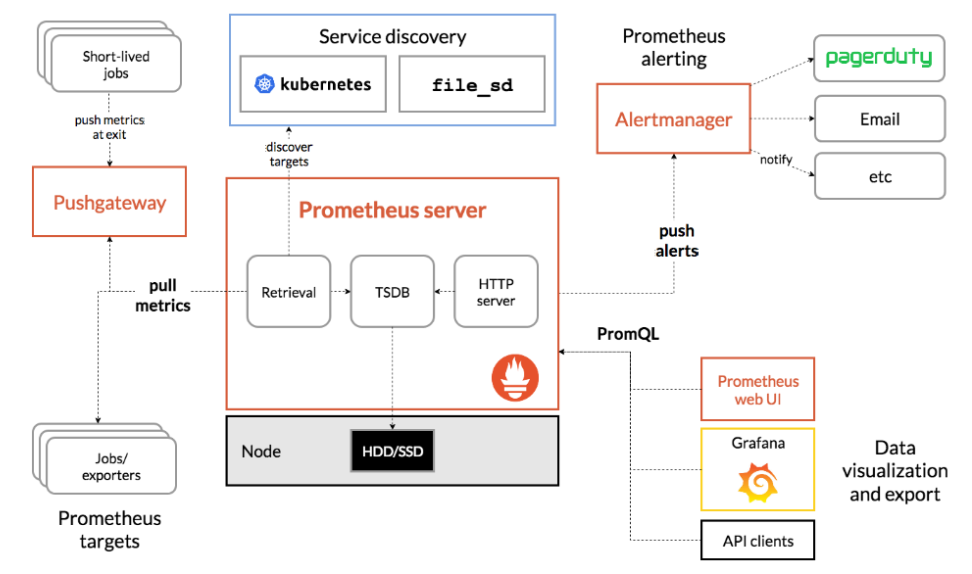
Prometheus是具有活跃生态系统的开源系统监视和警报工具包。下图是Prometheus的体系结构及其某些生态系统组件。最核心的位置就是Prometheus server,主要的作用就是根据我们的配置去用于收集和存储时间序列数据。Service discovery服务的发现,通过Service discovery,Prometheus server就会知道去哪里采集数据,有两种方式,一种是静态的,通过文件去配;另外一种是动态的,可以通过zookeeper或者其他的配置中心,当里面的数据变化时,去不同的地方抓取数据。Jobs/exporters,一般是我们的应用提供的,供Prometheus server抓取数据,这里是拉模式,好处是,对于我们的应用来说,不需要知道Prometheus的服务在哪,只需要暴漏我们的数据就可以了。Pushgateway,是用来支持推模式的,因为有些时候,我们的一些数据并不是一直存在的,比如说定时任务的数据,我们把短活的数据推送到Pushgateway,供Prometheus server从Pushgateway拉取数据。到这里数据采集的组件一件介绍完毕了。数据采集来了之后都放到Prometheus server中,通过HTTP server将数据暴漏出来供前端的一些应用通过PromQL来查询使用,进行数据的可视化和导出,推荐使用的组件时Grafana。Alertmanager来做告警,告警的方式有很多种,email、微信、钉钉或者自己写的接口等,可以对Prometheus server中的时间序列数据定制一些规则,出发了规则会推送到Alertmanager,但是它并不会立刻告警,而是会评估几次,防止误报。

2、Prometheus环境搭建
2.1、使用docker安装Prometheus文件结构

2.1.1、docker-compose.yml
version: "3"
services:
  prometheus:
    image: prom/prometheus:v2.4.3
    container_name: 'prometheus'
    volumes:
    - ./prometheus/:/etc/prometheus/
    ports:
    - '8999:9090'
2.1.2、prometheus.yml
#全局配置
global:
  #间隔多久去拉取一次数据
  scrape_interval:   15s

# 要拉取的目标是哪里
scrape_configs:
# 我们的springboot项目
- job_name:       'springboot-app'
  #间隔10s拉取一次数据,覆盖全局配置
  scrape_interval: 10s
  #请求的路径
  metrics_path: '/actuator/prometheus'

  static_configs:
  #去哪里抓取,因为我们的项目跑在本地电脑,所以配置运行docker的宿主机
  - targets: ['host.docker.internal:9080']
    #把抓取来的数据,添加一个标签
    labels:
      application: 'springboot-app'

#prometheus本机的监控
- job_name: 'prometheus'

  scrape_interval: 5s

  static_configs:
  - targets: ['localhost:9090']
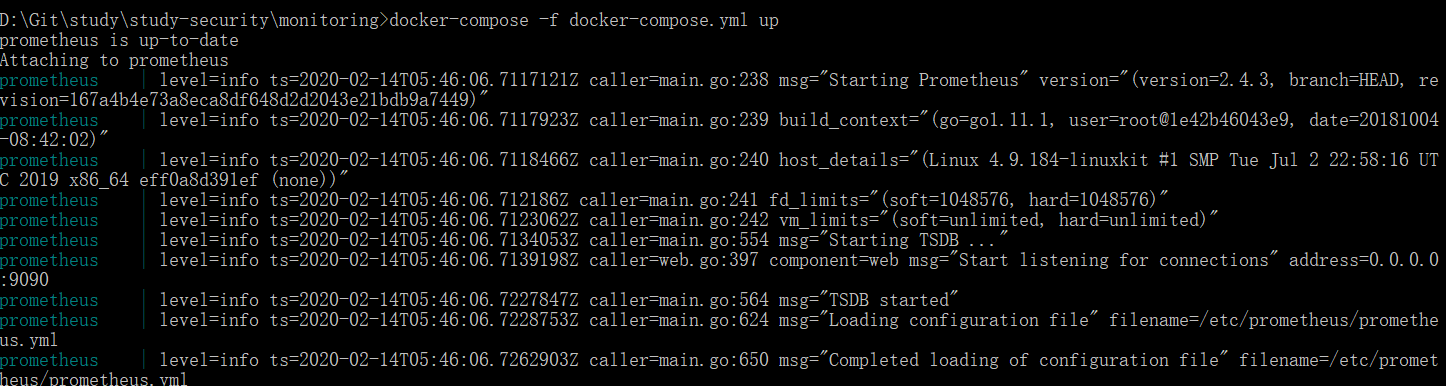
2.1.3、启动命令行,进入monitoring目录, 执行 docker-compose -f docker-compose.yml up 命令
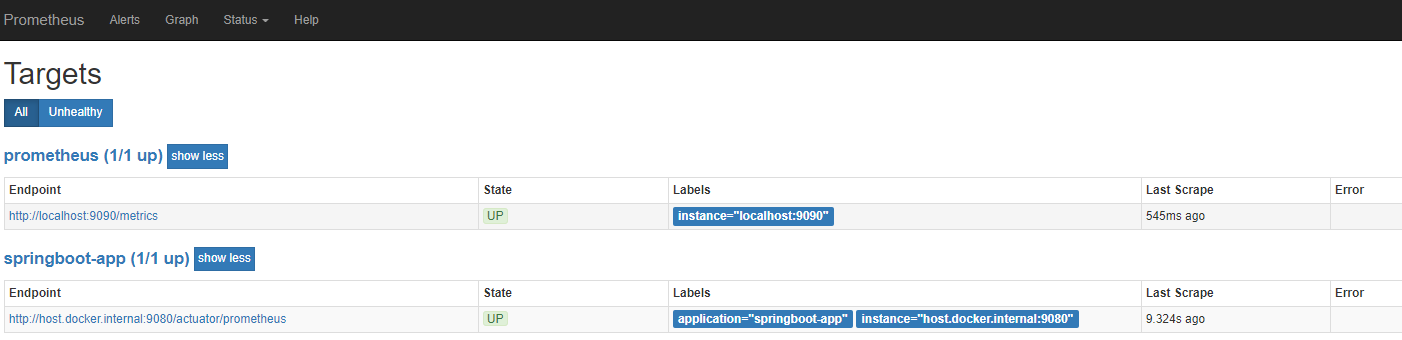
2.1.4、访问http://127.0.0.1:8999/ 可以访问,容器中部署的prometheus,通过Status->Targets可以看到我们配置的两个数据采集目标。Endpoint,代表数据端点、State代表当前状态,Labels代表标签,Last Scrape代表距上次拉去时间,Error代表错误信息。

3、SpringBoot整合Prometheus,我们以order服务为例
3.1、添加SpringBoot Actuator 监控端点依赖
        <dependency>
            <groupId>org.springframework.boot</groupId>
            <artifactId>spring-boot-starter-actuator</artifactId>
        </dependency>
3.2、添加micrometer-registry-prometheus依赖,在actuator中增加prometheus端点
        <dependency>
            <groupId>io.micrometer</groupId>
            <artifactId>micrometer-registry-prometheus</artifactId>
        </dependency>
3.3、application.yml配置对外暴漏端点,这里我们控制只暴露三个

3.4、资源服务配置端点请求,不用身份验证
package cn.caofanqi.security.config;

import org.springframework.boot.actuate.autoconfigure.security.servlet.EndpointRequest;
import org.springframework.context.annotation.Configuration;
import org.springframework.security.config.annotation.web.builders.HttpSecurity;
import org.springframework.security.oauth2.config.annotation.web.configuration.ResourceServerConfigurerAdapter;

/**
 * 资源服务器配置
 *
 * @author caofanqi
 * @date 2020/2/14 14:07
 */
@Configuration
public class ResourceServerConfig extends ResourceServerConfigurerAdapter {


    @Override
    public void configure(HttpSecurity http) throws Exception {
        http.authorizeRequests().requestMatchers(EndpointRequest.toAnyEndpoint()).permitAll()
                .anyRequest().authenticated();
    }
}
3.5、启动order服务,刷新http://127.0.0.1:8999/targets 页面,可以看到我们配置的端点,状态为up了
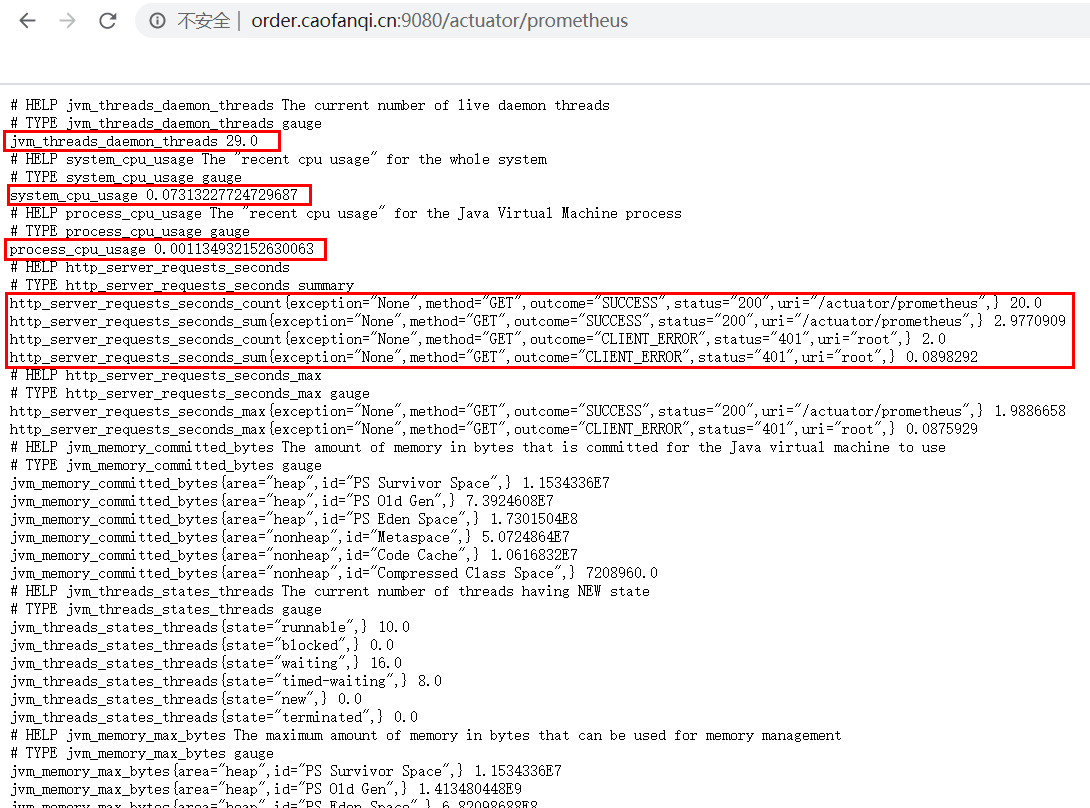
3.6、我们可以通过http://order.caofanqi.cn:9080/actuator/prometheus,看到服务为Prometheus提供的数据,都是一个数据名称跟着一个数字,有的数据名称带{},里面是这个数据名称的标签。
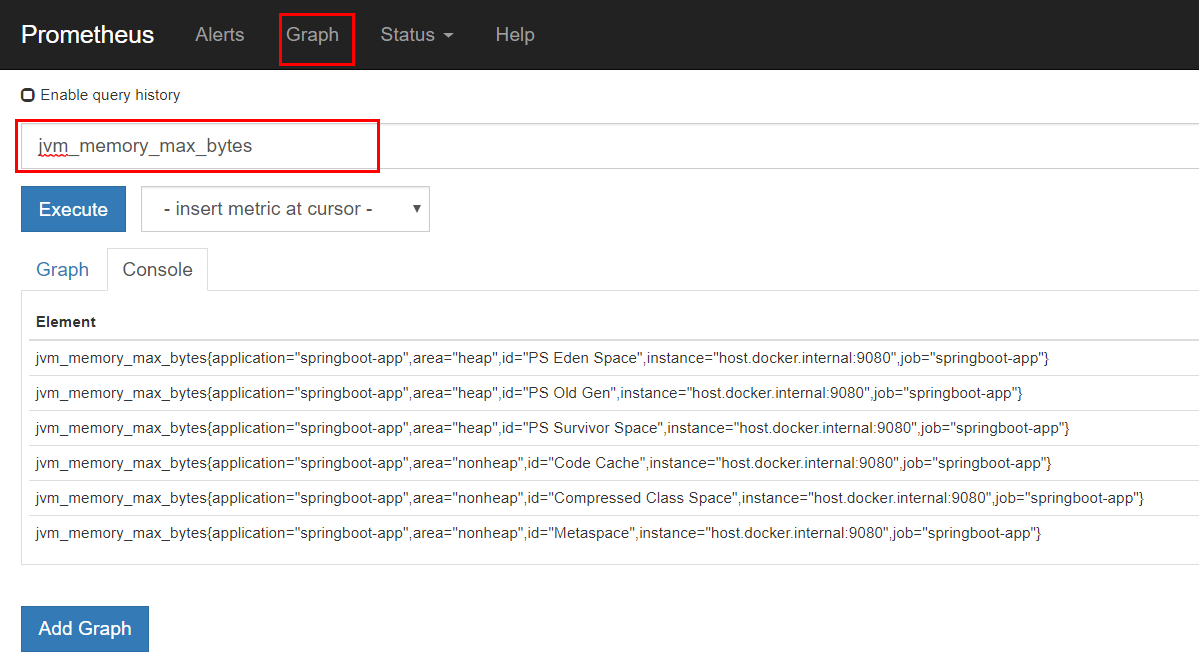
3.7、我们可以通过Prometheus的Graph来查看这些数据,这里{}中的标签,比我们项目中的多,那是因为它把prometheus.yml配置文件中一些配置也添加成标签了,job_name -> job、static_configs.labels.application -> application、static_configs.targets -> instance ,有利于我们对数据进行过滤。
3.8、还可以通过标签进行过滤、通过Graph看图分析

但是它自己提供的这个界面属实不太好看,下节我们用grafana来代替
项目源码:https://github.com/caofanqi/study-security/tree/dev-prometheus1