https://blog.csdn.net/LoseInVain/article/details/83108001
 https://github.com/tensorflow/tensorflow/blob/7dd20b844ced19610f8fa67be61d93948563ac43/tensorflow/python/ops/custom_gradient.py
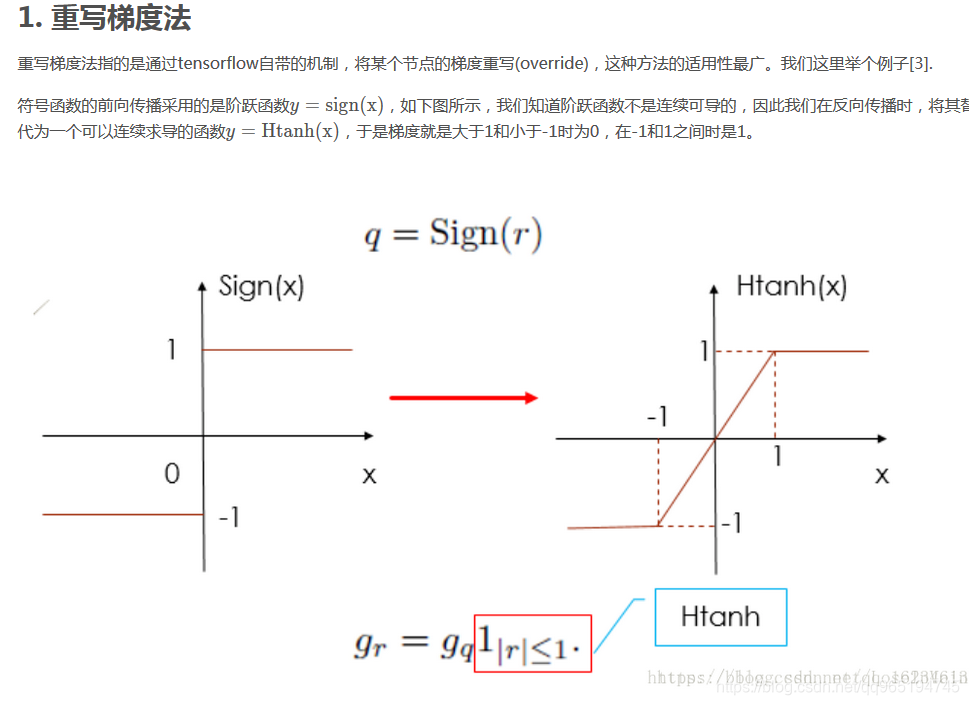
输入
import tensorflow as tf
import matplotlib.pyplot as plt
%matplotlib inline
@tf.custom_gradient
def DoublySign(x):
    def grad(dy):
        '''
        dy 是从反向而言的上一层的梯度
        '''
        cond = (x >= -1) & (x <= 1)
        zeros = tf.zeros_like(dy)
        return tf.where(cond,dy,zeros)
    # 这里相当于是在自己手动计算梯度,如果在-1和1之间,将sign的函数梯度修改为1,根据链式法则,梯度为dy*1=dy
    # 而其他情况下,梯度为dy*0=0
    # tf.where 和 tf.cond 的区别 https://blog.csdn.net/xiadimichen14908/article/details/83592282
    return tf.sign(x),grad


x = tf.constant(np.linspace(-2,2,100))
y = DoublySign(x)
grad = tf.gradients(y,x)
init = tf.global_variables_initializer()
with tf.Session() as sess:
    sess.run(init)
    print(x.eval())
    print(y.eval())
    print(sess.run(grad))
    plt.figure(figsize=(10,5))
    plt.subplot(1,2,1)
    ax = plt.gca()         # get current axis 获得坐标轴对象
    plt.xlabel('x')
    plt.ylabel('sign(x)')                                #设置坐标轴的文字标签
    ax.spines['right'].set_color('none')
    ax.spines['top'].set_color('none')         # 将右边 上边的两条边颜色设置为空 其实就相当于抹掉这两条边

    ax.xaxis.set_ticks_position('bottom')
    ax.yaxis.set_ticks_position('left')          # 指定下边的边作为 x 轴   指定左边的边为 y 轴

    ax.spines['bottom'].set_position(('data', 0))   #指定 data  设置的bottom(也就是指定的x轴)绑定到y轴的0这个点上
    ax.spines['left'].set_position(('data', 0))
    plt.plot(x.eval(),y.eval())
    plt.title("sign")
    plt.subplot(1,2,2)
    plt.xlabel('x')
    plt.ylabel('d(sign(x))')                                #设置坐标轴的文字标签
    plt.plot(x.eval(),sess.run(grad)[0])
    plt.title("sign grad")
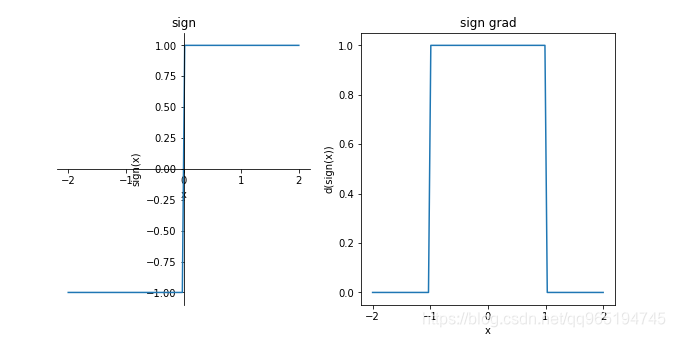
输出
[-2.         -1.95959596 -1.91919192 -1.87878788 -1.83838384 -1.7979798
 -1.75757576 -1.71717172 -1.67676768 -1.63636364 -1.5959596  -1.55555556
 -1.51515152 -1.47474747 -1.43434343 -1.39393939 -1.35353535 -1.31313131
 -1.27272727 -1.23232323 -1.19191919 -1.15151515 -1.11111111 -1.07070707
 -1.03030303 -0.98989899 -0.94949495 -0.90909091 -0.86868687 -0.82828283
 -0.78787879 -0.74747475 -0.70707071 -0.66666667 -0.62626263 -0.58585859
 -0.54545455 -0.50505051 -0.46464646 -0.42424242 -0.38383838 -0.34343434
 -0.3030303  -0.26262626 -0.22222222 -0.18181818 -0.14141414 -0.1010101
 -0.06060606 -0.02020202  0.02020202  0.06060606  0.1010101   0.14141414
  0.18181818  0.22222222  0.26262626  0.3030303   0.34343434  0.38383838
  0.42424242  0.46464646  0.50505051  0.54545455  0.58585859  0.62626263
  0.66666667  0.70707071  0.74747475  0.78787879  0.82828283  0.86868687
  0.90909091  0.94949495  0.98989899  1.03030303  1.07070707  1.11111111
  1.15151515  1.19191919  1.23232323  1.27272727  1.31313131  1.35353535
  1.39393939  1.43434343  1.47474747  1.51515152  1.55555556  1.5959596
  1.63636364  1.67676768  1.71717172  1.75757576  1.7979798   1.83838384
  1.87878788  1.91919192  1.95959596  2.        ]
[-1. -1. -1. -1. -1. -1. -1. -1. -1. -1. -1. -1. -1. -1. -1. -1. -1. -1.
 -1. -1. -1. -1. -1. -1. -1. -1. -1. -1. -1. -1. -1. -1. -1. -1. -1. -1.
 -1. -1. -1. -1. -1. -1. -1. -1. -1. -1. -1. -1. -1. -1.  1.  1.  1.  1.
  1.  1.  1.  1.  1.  1.  1.  1.  1.  1.  1.  1.  1.  1.  1.  1.  1.  1.
  1.  1.  1.  1.  1.  1.  1.  1.  1.  1.  1.  1.  1.  1.  1.  1.  1.  1.
  1.  1.  1.  1.  1.  1.  1.  1.  1.  1.]
[array([0., 0., 0., 0., 0., 0., 0., 0., 0., 0., 0., 0., 0., 0., 0., 0., 0.,
       0., 0., 0., 0., 0., 0., 0., 0., 1., 1., 1., 1., 1., 1., 1., 1., 1.,
       1., 1., 1., 1., 1., 1., 1., 1., 1., 1., 1., 1., 1., 1., 1., 1., 1.,
       1., 1., 1., 1., 1., 1., 1., 1., 1., 1., 1., 1., 1., 1., 1., 1., 1.,
       1., 1., 1., 1., 1., 1., 1., 0., 0., 0., 0., 0., 0., 0., 0., 0., 0.,
       0., 0., 0., 0., 0., 0., 0., 0., 0., 0., 0., 0., 0., 0., 0.])]
测试两个参数的写法
import tensorflow as tf
import matplotlib.pyplot as plt
%matplotlib inline
@tf.custom_gradient
def DoublySign(x1,x2):
    def grad(dy1,dy2):
        '''
        dy 是从反向而言的上一层的梯度
        '''
        cond = (x1 >= -1) & (x1 <= 1)
        zeros = tf.zeros_like(dy1)
        return tf.where(cond,dy1,zeros),dy2
    # 这里相当于是在自己手动计算梯度,如果在-1和1之间,将sign的函数梯度修改为1,根据链式法则,梯度为dy*1=dy
    # 而其他情况下,梯度为dy*0=0
    # tf.where 和 tf.cond 的区别 https://blog.csdn.net/xiadimichen14908/article/details/83592282
    return (tf.sign(x1),x2),grad


x1 = tf.constant(np.linspace(-2,2,100))
x2 = tf.constant(np.linspace(-2,2,100))
y1,y2 = DoublySign(x1,x2)
grad1 = tf.gradients(y1,x1)
grad2 = tf.gradients(y2,x2)
init = tf.global_variables_initializer()
with tf.Session() as sess:
#     sess.run(init)
#     print(x1.eval())
#     print(x2.eval())
#     print(y1.eval())
#     print(y2.eval())
#     print(sess.run(grad1))
#     print(sess.run(grad2))
    plt.figure(figsize=(10,5))
    plt.subplot(2,2,1)
    ax = plt.gca()         # get current axis 获得坐标轴对象
    plt.xlabel('x')
    plt.ylabel('sign(x)')                                #设置坐标轴的文字标签
    ax.spines['right'].set_color('none')
    ax.spines['top'].set_color('none')         # 将右边 上边的两条边颜色设置为空 其实就相当于抹掉这两条边

    ax.xaxis.set_ticks_position('bottom')
    ax.yaxis.set_ticks_position('left')          # 指定下边的边作为 x 轴   指定左边的边为 y 轴

    ax.spines['bottom'].set_position(('data', 0))   #指定 data  设置的bottom(也就是指定的x轴)绑定到y轴的0这个点上
    ax.spines['left'].set_position(('data', 0))
    plt.plot(x1.eval(),y1.eval())
    plt.title("sign")
    plt.subplot(2,2,2)
    plt.xlabel('x')
    plt.ylabel('d(sign(x))')                                #设置坐标轴的文字标签
    plt.plot(x1.eval(),sess.run(grad1)[0])
    plt.title("sign grad")

    plt.subplot(2,2,3)
    ax = plt.gca()         # get current axis 获得坐标轴对象
    plt.xlabel('x')
    plt.ylabel('sign(x)')                                #设置坐标轴的文字标签
    ax.spines['right'].set_color('none')
    ax.spines['top'].set_color('none')         # 将右边 上边的两条边颜色设置为空 其实就相当于抹掉这两条边

    ax.xaxis.set_ticks_position('bottom')
    ax.yaxis.set_ticks_position('left')          # 指定下边的边作为 x 轴   指定左边的边为 y 轴

    ax.spines['bottom'].set_position(('data', 0))   #指定 data  设置的bottom(也就是指定的x轴)绑定到y轴的0这个点上
    ax.spines['left'].set_position(('data', 0))
    plt.plot(x2.eval(),y2.eval())
    plt.title("sign")
    plt.subplot(2,2,4)
    plt.xlabel('x')
    plt.ylabel('d(sign(x))')                                #设置坐标轴的文字标签
    plt.plot(x2.eval(),sess.run(grad2)[0])
    plt.title("sign grad")

