Classification: The purer the set, the smaller the degree of aliasing, the simpler the classification.
Metrics that measure the degree of information mixture
Entropy:
Entropy is a quantitative indicator of the uncertainty of random variables.
Entropy is defined as the expected value ( x*p(x) =possible value(called ONE kind of result) * probability )of the information.
If you’re classifying something that can take on multiple values(sub-class), the information for symbol xi is defined as![]() , where p(xi) is the probability of choosing this class(xi, sub-class).
, where p(xi) is the probability of choosing this class(xi, sub-class).
To calculate entropy, we need the expected value of all the information of all possible values of our class(such as color =feature=class: red, yellow, green, black, white(sub-class)...). This is given by ![]() where n is the number of classes(sub-class).
where n is the number of classes(sub-class).
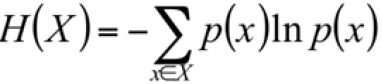 , X(uppercase X called Random Variable or random event), x (lowercase x called possible value of random variable or event result, here the event result = ln p(x) 。 So the smaller the probability that the result of event x occurs, the larger the amount of information
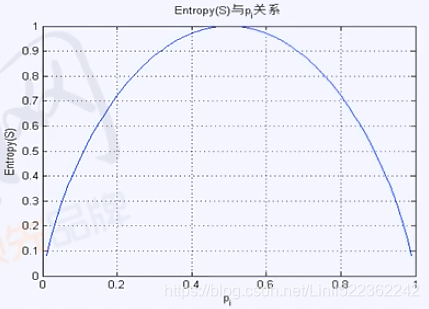
two results(two possible values(0 or 1))
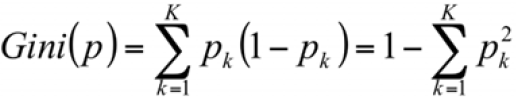
Gini Index:

a measure of total variance across the K classes. It is not hard to see that the Gini index takes on a small value if all of the pk’s are close to zero or one(1). For this reason the Gini index is referred to as a measure of
node purity—a small value indicates that a node contains predominantly observations from a single class.
Why we choose Entropy to measure the information?
The higher the degree of hybridization(mixture), the closer the Gini index is to one(1), and the larger the entropy value (>>1)

Information Gain: Entropy - conditional entropy
The change in information before and after the split is known as the information gain. When you know how to calculate the information gain, you can split your data across every feature to see which split gives you the highest information gain. The split with the highest information gain is your best option.
Conditional entropy:Given condition Y(feature), Event X still contain uncertainty.

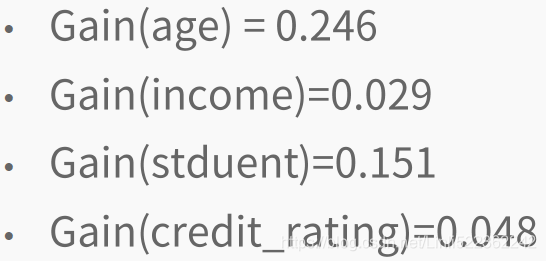
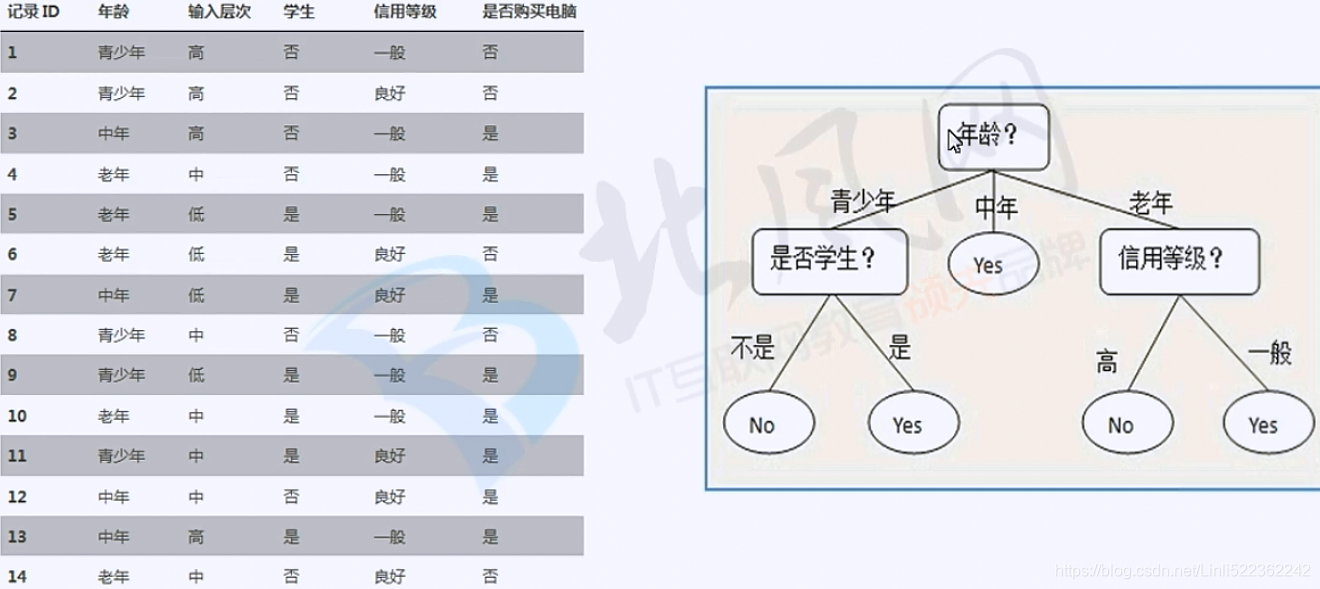
So we choose age(feature) to split our dataset.

# -*- coding: utf-8 -*-
"""
Created on Tue Oct 30 18:03:32 2018
@author: LlQ
"""
##############################################################################
#to calculate the Shannon entropy of a dataset base on list[list[-1]]: classify
#The change in information before and after the split is known as the
#information gain
#Entropy is defined as the expected value of the information
#if you're classifying something that can take one multiple values, the
# information for symbol xi is defined as
# l(xi) = log(p(xi),2) where p(xi) is the probability of choosing this class
#H=-sum{ p(xi) * log(p(xi),2) } and i from 1 to n
##############################################################################
from math import log
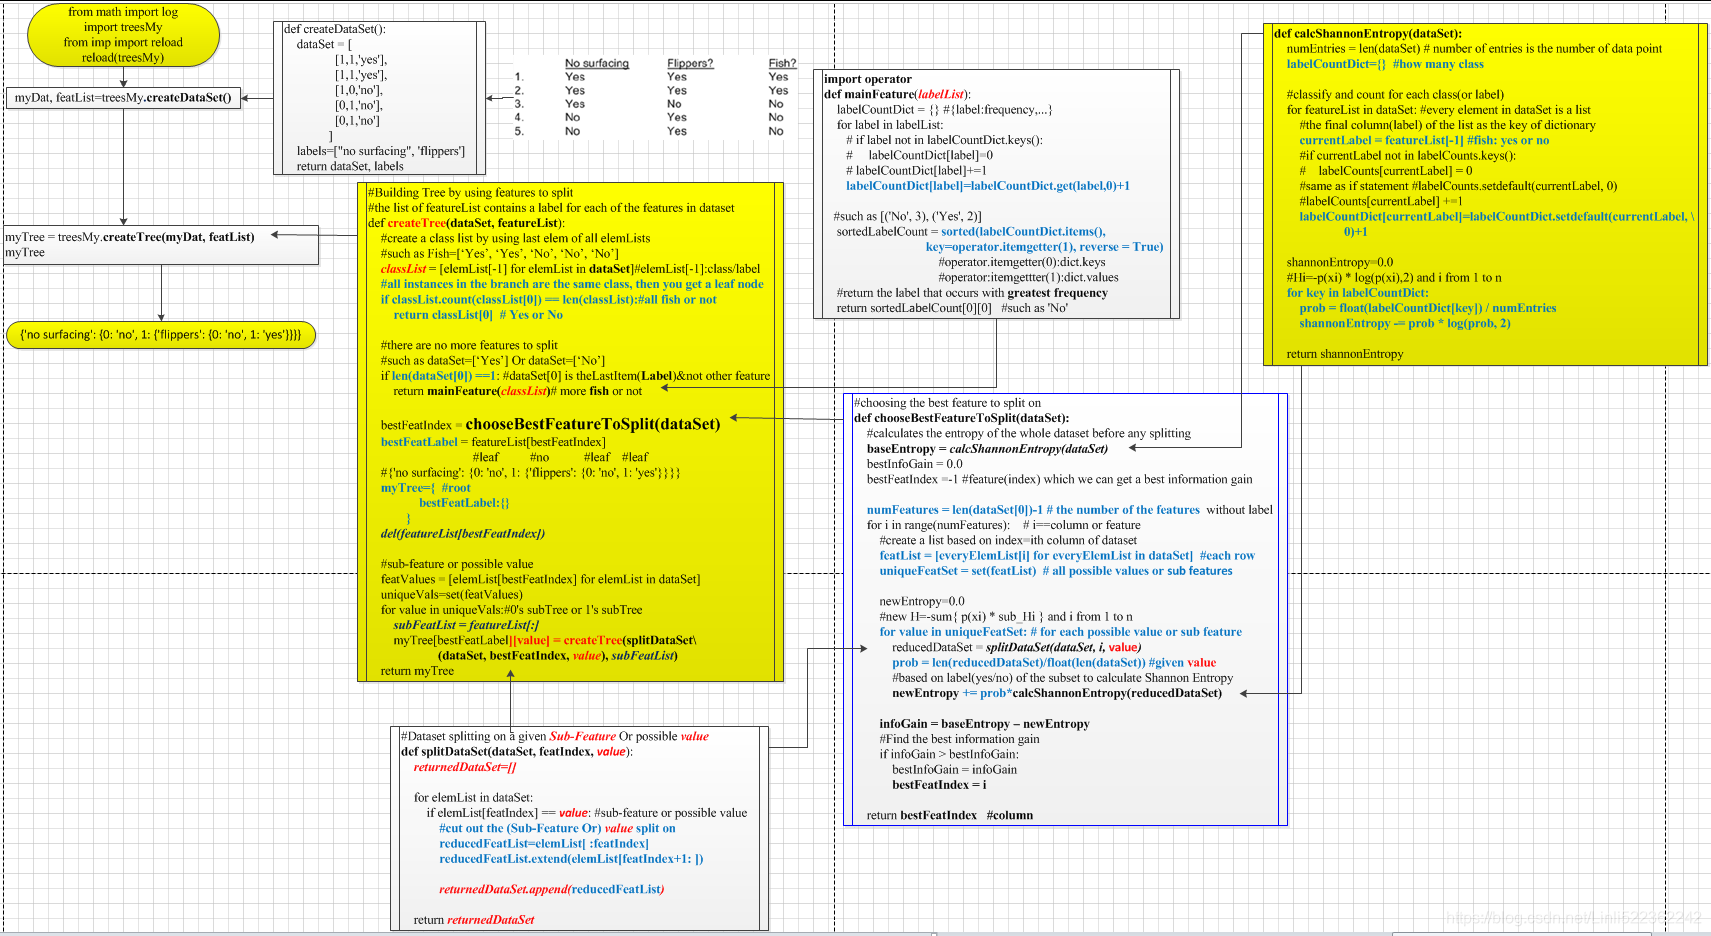
def calcShannonEntropy(dataSet):
numEntries = len(dataSet) # number of entries is the number of data point
labelCountDict={} #how many class
#classify and count for each class(or label)
for featureList in dataSet: #every element in dataSet is a list
#the final column(label) of the list as the key of dictionary
currentLabel = featureList[-1]
#if currentLabel not in labelCounts.keys():
# labelCounts[currentLabel] = 0
#same as if statement #labelCounts.setdefault(currentLabel, 0)
#labelCounts[currentLabel] +=1
labelCountDict[currentLabel]=labelCountDict.setdefault(currentLabel, \
0)+1
shannonEntropy=0.0
#Hi=-p(xi) * log(p(xi),2) and i from 1 to n
#print(dataSet)
for key in labelCountDict:
prob = float(labelCountDict[key]) / numEntries
#print("key: ", key,", prob: ",prob)
shannonEntropy -= prob * log(prob, 2)
return shannonEntropy
def createDataSet():
dataSet = [
[1,1,'yes'],
[1,1,'yes'],
[1,0,'no'],
[0,1,'no'],
[0,1,'no']
]
labels=["no surfacing", 'flippers']
return dataSet, labels
##############################################################################
# jupyter Notebook test
# import treesMy
# from imp import reload
# reload(treesMy)
# myDataSet, labels=treesMy.createDataSet()
# myDataSet
# [[1, 1, 'yes'], [1, 1, 'yes'], [1, 0, 'no'], [0, 1, 'no'], [0, 1, 'no']]
# treesMy.calcShannonEntropy(myDataSet)
# 0.9709505944546686
# myDataSet[0][-1]='maybe'
# myDataSet
# [[1, 1, 'maybe'], [1, 1, 'yes'], [1, 0, 'no'], [0, 1, 'no'], [0, 1, 'no']]
# treesMy.calcShannonEntropy(myDataSet)
# 1.3709505944546687
##############################################################################
#Dataset splitting on a given feature
def splitDataSet(dataSet, featIndex, feature):
returnedDataSet=[]
for elemList in dataSet:
if elemList[featIndex] == feature:
#cut out the feature split on
reducedFeatList=elemList[ :featIndex]
reducedFeatList.extend(elemList[featIndex+1: ])
#print(feature,reducedFeatList, elemList)
returnedDataSet.append(reducedFeatList)
return returnedDataSet
##############################################################################
# jupyter Notebook test
# import treesMy
# from imp import reload
# reload(treesMy)
# myDat, labels=treesMy.createDataSet()
# myDat
# [[1, 1, 'yes'], [1, 1, 'yes'], [1, 0, 'no'], [0, 1, 'no'], [0, 1, 'no']]
# treesMy.splitDataSet(myDat, 0, 1)
# [[1, 'yes'], [1, 'yes'], [0, 'no']]
# treesMy.splitDataSet(myDat,0,0)
# [[1, 'no'], [1, 'no']]
##############################################################################
#choosing the best feature to split on
#choosing the best feature to split on
def chooseBestFeatureToSplit(dataSet):
#calculates the entropy of the whole dataset before any splitting
baseEntropy = calcShannonEntropy(dataSet)
bestInfoGain = 0.0
bestFeatIndex =-1 #feature(index) which we can get a best information gain
numFeatures = len(dataSet[0])-1 # the number of the features without label
for i in range(numFeatures): # i==column or feature
#create a list based on index=ith column of dataset
featList = [everyElemList[i] for everyElemList in dataSet] #each row
uniqueFeatSet = set(featList) # all possible values or sub features
newEntropy=0.0
#new H=-sum{ p(xi) * sub_Hi } and i from 1 to n
for value in uniqueFeatSet: # for each possible value or sub feature
reducedDataSet = splitDataSet(dataSet, i, value)
prob = len(reducedDataSet)/float(len(dataSet))#given value
#print("cut out: ", value,"reducedDataSet: ", reducedDataSet)
#print(prob)
#print('*'*10)
#based on label(yes/no) of the subset to calculate Shannon Entropy
newEntropy += prob*calcShannonEntropy(reducedDataSet)
infoGain = baseEntropy - newEntropy
#Find the best information gain
if infoGain > bestInfoGain:
bestInfoGain = infoGain
bestFeatIndex = i
return bestFeatIndex
##############################################################################
# jupyter Notebook test
# import treesMy
# from imp import reload
# reload(treesMy)
# myDat, labels=treesMy.createDataSet()
# featureIndex=trees.chooseBestFeatureToSplit(myDat)
# featureIndex
# 0
# featList = [everyElemList[featureIndex] for everyElemList in myDat]
# featList
# [1, 1, 1, 0, 0]
#labels[featureIndex]
# 'no surfacing'
##############################################################################
import operator
def mainFeature(labelList):
labelCountDict = {} #{label:frequency,...}
for label in labelList:
# if label not in labelCountDict.keys():
# labelCountDict[label]=0
# labelCountDict[label]+=1
labelCountDict[label]=labelCountDict.get(label,0)+1
##such as [('No', 3), ('Yes', 2)]
sortedLabelCount = sorted(labelCountDict.items(),
key=operator.itemgetter(1), reverse = True)
#operator.itemgetter(0):dict.keys
#operator:itemgettter(1):dict.values
#return the Label that occurs with greatest frequency
return sortedLabelCount[0][0] #such as 'No'
#Building Tree by using features to split
#the list of featureList contains a label for each of the features in dataset
def createTree(dataSet, featureList):
#create a class list by using last elem of all elemLists
classList = [elemList[-1] for elemList in dataSet]#elemList[-1]:class/label
#all instances in the branch are the same class, then you get a leaf node
if classList.count(classList[0]) == len(classList):#all fish or not
return classList[0]
#there are no more features to split
if len(dataSet[0]) ==1: #dataSet[0] is theLastItem(class)¬ other feature
return mainFeature(classList)# more fish or not
bestFeatIndex = chooseBestFeatureToSplit(dataSet)
bestFeatLabel = featureList[bestFeatIndex]
myTree={
bestFeatLabel:{}
}
del(featureList[bestFeatIndex])
featValues = [elemList[bestFeatIndex] for elemList in dataSet]
uniqueVals=set(featValues)
for value in uniqueVals:#0's subTree or 1's subTree
subFeatList = featureList[:]
myTree[bestFeatLabel][value] = createTree(splitDataSet\
(dataSet, bestFeatIndex, value), subFeatList)
return myTree
##############################################################################
# import treesMy
# from imp import reload
# reload(treesMy)
# myDat, featList = treesMy.createDataSet()
# myTree = treesMy.createTree(myDat, featList)
# myTree
# {'no surfacing': {0: 'no', 1: {'flippers': {0: 'no', 1: 'yes'}}}
##############################################################################
#Classification function for an existing decision tree
#testSplitList is corresponding to brandFeatList
def classify(inputTree, branchFeatList, testSplitList):
rootKey = list(inputTree.keys())[0] #input #inputTree is a dict with one key
secondDict = inputTree[rootKey]#rootKey:value is a dict
#translate rootKey(label string) to index in branchFeatList
featIndex = branchFeatList.index(rootKey)
for key in secondDict.keys():
if testSplitList[featIndex] == key:#0 or 1
if type(secondDict[key]).__name__=='dict':
classLabel = classify(secondDict[key], branchFeatList, \
testSplitList)
else:
classLabel = secondDict[key]
return classLabel
##############################################################################
#import treePlotterMy
#import treesMy
#from imp import reload
#reload(treePlotterMy)
#reload(treesMy)
#myDat, labels = treesMy.createDataSet()
#myDat
#[[1, 1, 'yes'], [1, 1, 'yes'], [1, 0, 'no'], [0, 1, 'no'], [0, 1, 'no']]
#copyLabel=labels.copy()
#copyLabel
#['no surfacing', 'flippers']
#myTree=treesMy.createTree(myDat, labels)
#treePlotterMy.createPlot(myTree)
#myTree
# {'no surfacing': {0: 'no', 1: {'flippers': {0: 'no', 1: 'yes'}}}}
#labels
# ['flippers']
#copyLabel
# ['no surfacing', 'flippers']
#trees.classify(myTree, copyLabel, [1,0])
# 'no'
##############################################################################
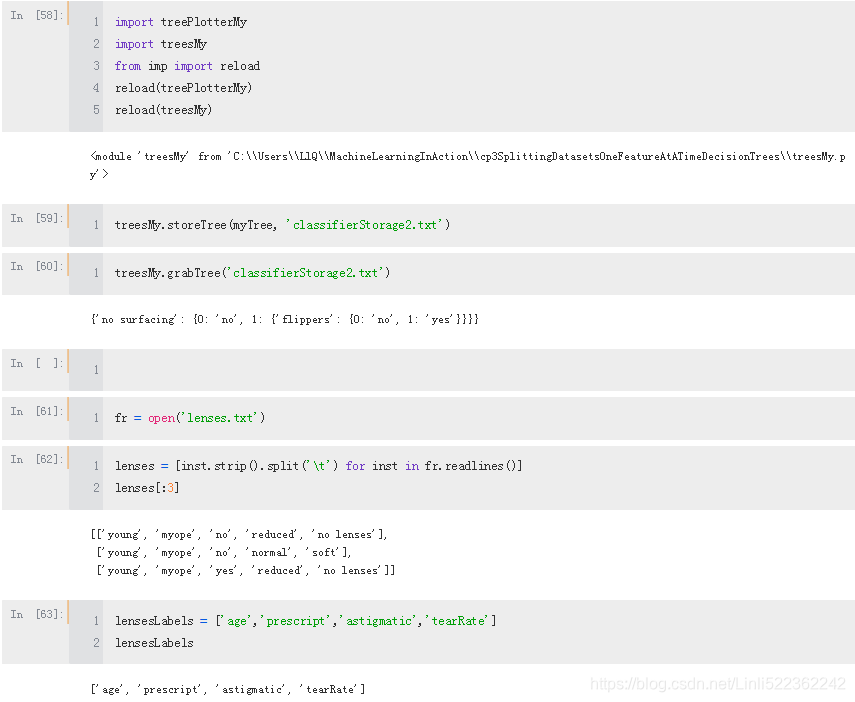
def storeTree(inputTree, filename):
import pickle
fw=open(filename, 'wb')
pickle.dump(inputTree, fw)
fw.close()
def grabTree(filename):
import pickle
fr=open(filename,'rb')
return pickle.load(fr)
##############################################################################
#treesMy.storeTree(myTree, 'classifierStorage2.txt')
#treesMy.grabTree('classifierStorage2.txt')
#{'no surfacing': {0: 'no', 1: {'flippers': {0: 'no', 1: 'yes'}}}}
#fr = open('lenses.txt')
#lenses = [inst.strip().split('\t') for inst in fr.readlines()]
#lenses[:3]
# [['young', 'myope', 'no', 'reduced', 'no lenses'],
# ['young', 'myope', 'no', 'normal', 'soft'],
# ['young', 'myope', 'yes', 'reduced', 'no lenses']]
#lensesLabels = ['age','prescript','astigmatic','tearRate']
#lensesLabels
#['age', 'prescript', 'astigmatic', 'tearRate']
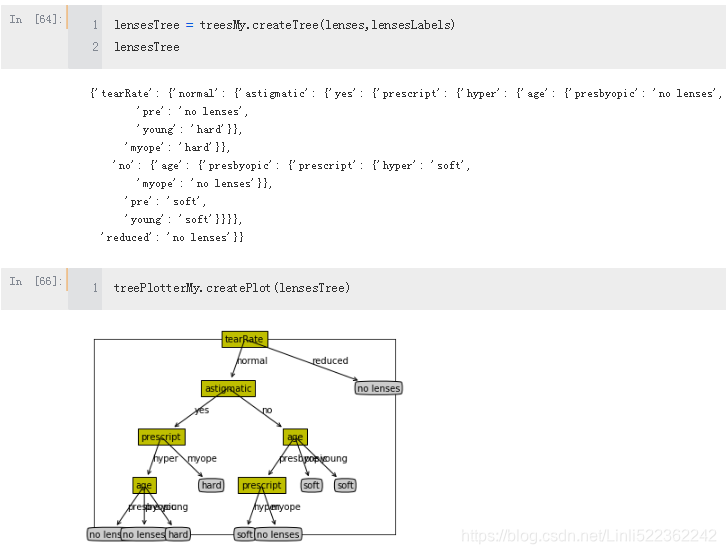
#lensesTree = treesMy.createTree(lenses,lensesLabels)
#lensesTree
# {'tearRate': {'normal': {'astigmatic': {'no': {'age': {'pre': 'soft',
# 'presbyopic': {'prescript': {'myope': 'no lenses', 'hyper': 'soft'}},
# 'young': 'soft'}},
# 'yes': {'prescript': {'myope': 'hard',
# 'hyper': {'age': {'pre': 'no lenses',
# 'presbyopic': 'no lenses',
# 'young': 'hard'}}}}}},
# 'reduced': 'no lenses'}}
#treePlotterMy.createPlot(lensesTree)
##############################################################################
# -*- coding: utf-8 -*-
"""
Created on Mon Nov 5 23:15:15 2018
@author: LlQ
"""
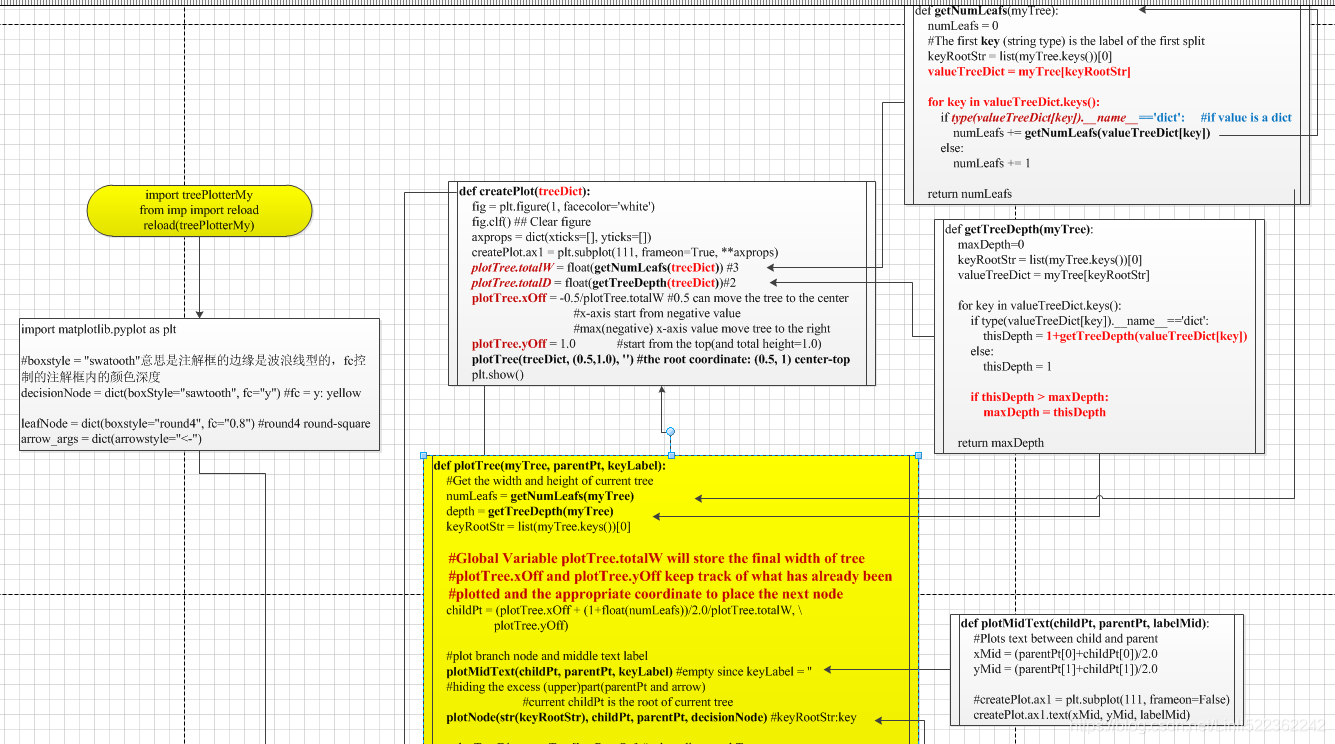
import matplotlib.pyplot as plt
#boxstyle = "swatooth"意思是注解框的边缘是波浪线型的,fc控制的注解框内的颜色深度
decisionNode = dict(boxStyle="sawtooth", fc="y") #fc = y: yellow
leafNode = dict(boxstyle="round4", fc="0.8") #round4 round-square
arrow_args = dict(arrowstyle="<-")
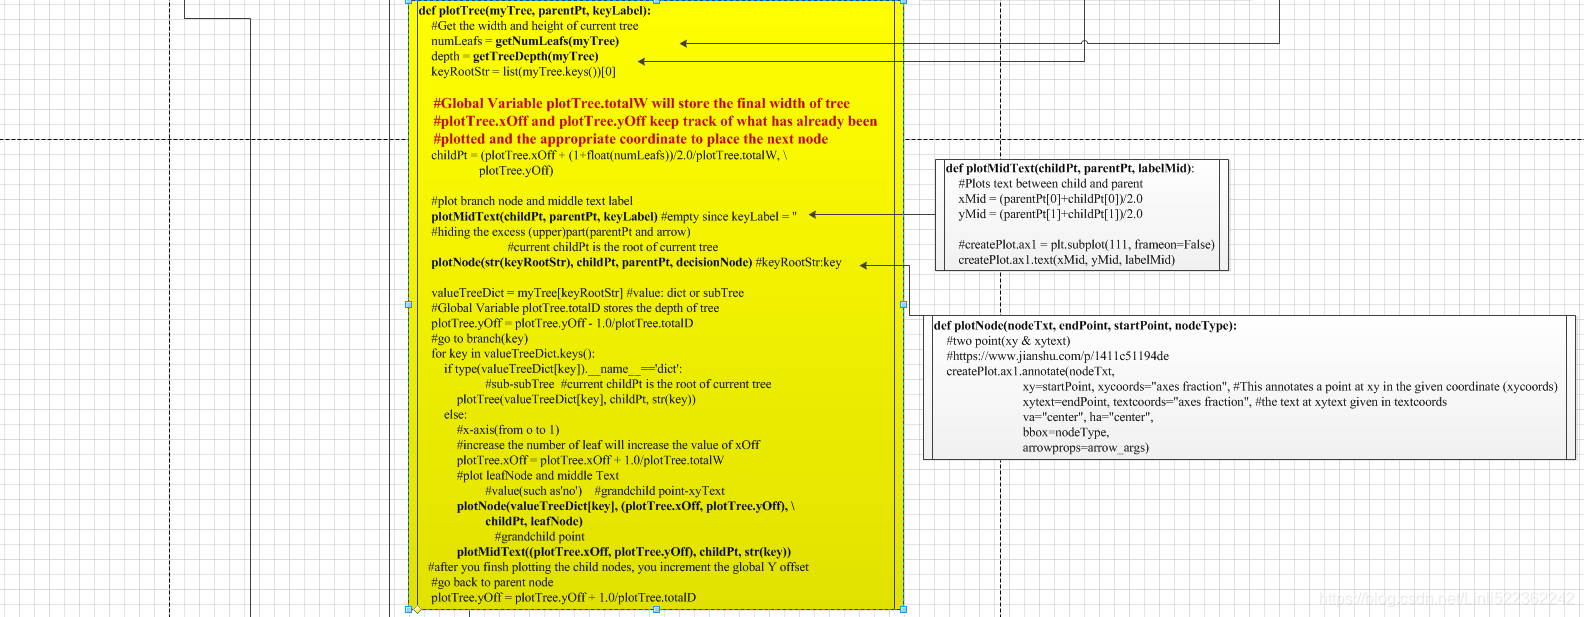
def plotNode(nodeTxt, endPoint, startPoint, nodeType):
#two point(xy & xytext)
#https://www.jianshu.com/p/1411c51194de
createPlot.ax1.annotate(nodeTxt,
xy=startPoint, xycoords="axes fraction", #This annotates a point at xy in the given coordinate (xycoords)
xytext=endPoint, textcoords="axes fraction", #the text at xytext given in textcoords
va="center", ha="center",
bbox=nodeType,
arrowprops=arrow_args)
def createPlot(): #panel color="white"
fig = plt.figure(1, facecolor = 'white')
fig.clf() #clear the current figure
createPlot.ax1 = plt.subplot(111, frameon=False)##frameon是否绘制矩形坐标轴
#endPoint #startPoint
plotNode("a decision node", (0.5,0.1), (0.1,0.5), decisionNode)
plotNode("a leaf node", (0.8,0.1), (0.3,0.8), leafNode)
plt.show()
##############################################################################
# import treePlotterMy
# from imp import reload
# reload(treePlotterMy)
# treePlotterMy.createPlot()
##############################################################################
#Identifying the number of leaves in a tree and the depth
#myTree
#{'no surfacing': {0: 'no',
# 1: {'flippers': {0: 'no',
# 1: 'yes'
# }
# }
# }
#}
def getNumLeafs(myTree):
numLeafs = 0
#The first key (string type) is the label of the first split
keyRootStr = list(myTree.keys())[0]
valueTreeDict = myTree[keyRootStr]
for key in valueTreeDict.keys():
if type(valueTreeDict[key]).__name__=='dict': #if value is a dict
numLeafs += getNumLeafs(valueTreeDict[key])
else:
numLeafs += 1
return numLeafs
def getTreeDepth(myTree):
maxDepth=0
keyRootStr = list(myTree.keys())[0]
valueTreeDict = myTree[keyRootStr]
for key in valueTreeDict.keys():
if type(valueTreeDict[key]).__name__=='dict':
thisDepth = 1+getTreeDepth(valueTreeDict[key])
else:
thisDepth = 1
if thisDepth > maxDepth:
maxDepth = thisDepth
return maxDepth
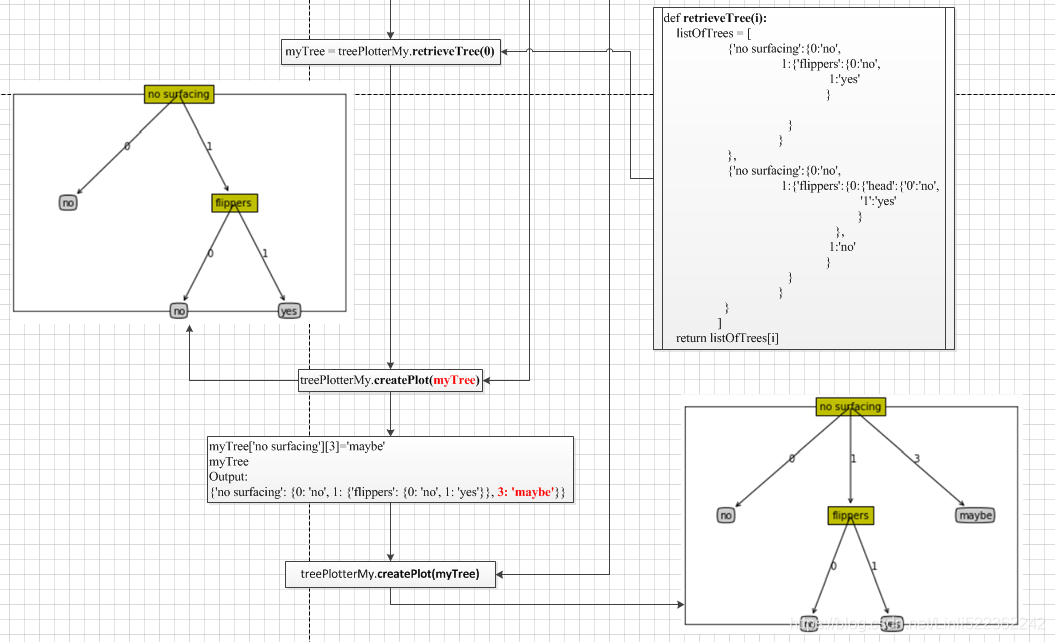
def retrieveTree(i):
listOfTrees = [
{'no surfacing':{0:'no',
1:{'flippers':{0:'no',
1:'yes'
}
}
}
},
{'no surfacing':{0:'no',
1:{'flippers':{0:{'head':{'0':'no',
'1':'yes'
}
},
1:'no'
}
}
}
}
]
return listOfTrees[i]
##############################################################################
# import treePlotterMy
# from imp import reload
# reload(treePlotterMy)
# treePlotterMy.retrieveTree(1)
# {'no surfacing': {0: 'no',
# 1: {'flippers': {0: {'head': {'0': 'no', '1': 'yes'}}, 1: 'no'}}}}
# myTree=treePlotterMy.retrieveTree(0)
# myTree
# {'no surfacing': {0: 'no', 1: {'flippers': {0: 'no', 1: 'yes'}}}}
# treePlotterMy.getNumLeafs(myTree)
# 3
# treePlotter.getTreeDepth(myTree)
# 2
##############################################################################
#The plotTree function
def plotMidText(childPt, parentPt, labelMid):
#Plots text between child and parent
xMid = (parentPt[0]+childPt[0])/2.0
yMid = (parentPt[1]+childPt[1])/2.0
#createPlot.ax1 = plt.subplot(111, frameon=False)
createPlot.ax1.text(xMid, yMid, labelMid)
def plotTree(myTree, parentPt, keyLabel):
#Get the width and height of current tree
numLeafs = getNumLeafs(myTree)
depth = getTreeDepth(myTree)
keyRootStr = list(myTree.keys())[0]
#Global Variable plotTree.totalW will store the final width of tree
#plotTree.xOff and plotTree.yOff keep track of what has already been
#plotted and the appropriate coordinate to place the next node
childPt = (plotTree.xOff + (1+float(numLeafs))/2.0/plotTree.totalW, \
plotTree.yOff)
#plot branch node and middle text label
plotMidText(childPt, parentPt, keyLabel) #empty since keyLabel = ''
#hiding the excess (upper)part(parentPt and arrow)
#current childPt is the root of current tree
plotNode(str(keyRootStr), childPt, parentPt, decisionNode) #keyRootStr:key
valueTreeDict = myTree[keyRootStr] #value: dict or subTree
#Global Variable plotTree.totalD stores the depth of tree
plotTree.yOff = plotTree.yOff - 1.0/plotTree.totalD
#go to branch(key)
for key in valueTreeDict.keys():
if type(valueTreeDict[key]).__name__=='dict':
#sub-subTree #current childPt is the root of current tree
plotTree(valueTreeDict[key], childPt, str(key))
else:
#x-axis(from o to 1)
#increase the number of leaf will increase the value of xOff
plotTree.xOff = plotTree.xOff + 1.0/plotTree.totalW
#plot leafNode and middle Text
#value(such as'no') #grandchild point-xyText
plotNode(valueTreeDict[key], (plotTree.xOff, plotTree.yOff), \
childPt, leafNode)
#grandchild point
plotMidText((plotTree.xOff, plotTree.yOff), childPt, str(key))
#after you finsh plotting the child nodes, you increment the global Y offset
#go back to parent node
plotTree.yOff = plotTree.yOff + 1.0/plotTree.totalD
def createPlot(treeDict):
fig = plt.figure(1, facecolor='white')
fig.clf()
axprops = dict(xticks=[], yticks=[])
createPlot.ax1 = plt.subplot(111, frameon=True, **axprops)
plotTree.totalW = float(getNumLeafs(treeDict)) #3
plotTree.totalD = float(getTreeDepth(treeDict))#2
plotTree.xOff = -0.5/plotTree.totalW #0.5 can move the tree to the center
#x-axis start from negative value
#max(negative) x-axis value move tree to the right
plotTree.yOff = 1.0 #start from the top(and total height=1.0)
plotTree(treeDict, (0.5,1.0), '') #the root coordinate: (0.5, 1) center-top
plt.show()
##############################################################################
# import treePlotterMy
# from imp import reload
# reload(treePlotterMy)
# myTree = treePlotterMy.retrieveTree(0)
# treePlotterMy.createPlot(myTree)
# myTree['no surfacing'][3]='maybe'
# myTree
# {'no surfacing': {0: 'no', 1: {'flippers': {0: 'no', 1: 'yes'}}, 3: 'maybe'}}
# treePlotterMy.createPlot(myTree)