matplotlib总结
4种线性 : - 实线 --虚线 -.点划线 :点线
"^"triangle_up"<"triangle_left">"triangle_right"1"tri_down
"2"tri_up"3"tri_left"4"tri_right"8"octagon
"s"square"p"pentagon"*"star"h"hexagon1"H"hexagon2
"+"plus"x"x"D"diamond"d"thin_diamond
# 创建一个 8 * 6 点(point)的图,并设置分辨率为 80
figure(figsize=(8,6), dpi=80)
plt.figure(1) # 第一张图
plt.subplot(211) # 第一张图中的第一张子图
plt.xlabel('Smarts')
plt.ylabel('Probability')
#添加标题
plt.title('Histogram of IQ')
#添加文字
plt.text(60, .025, r'$\mu=100,\ \sigma=15$')
#图中任意位置(60, .025)添加文字
plt.axis([40, 160, 0, 0.03])
#设置坐标大小,或x,y分别设置
xlim(-4.0,4.0)
ylim(-4.0,4.0)
xmin ,xmax = X.min(), X.max()
ymin, ymax = Y.min(), Y.max()
dx = (xmax - xmin) * 0.2
dy = (ymax - ymin) * 0.2
xlim(xmin - dx, xmax + dx)
ylim(ymin - dy, ymax + dy)
#横纵坐标起始终止位置
xticks([-np.pi, -np.pi/2, 0, np.pi/2, np.pi],[r'$-\pi$', r'$-\pi/2$', r'$0$', r'$+\pi/2$', r'$+\pi$'])
或 xticks(np.linspace(-4,4,9,endpoint=True))
yticks([-1, 0, +1], [r'$-1$', r'$0$', r'$+1$'])
# 设置轴记号,轴记号的标签
plt.annotate('local max', xy=(2, 1), xytext=(3, 1.5),arrowprops=dict(facecolor='black', shrink=0.05),)
plot(X, C, color="blue", linewidth=2.5, linestyle="-", label="cosine")
plot(X, S, color="red", linewidth=2.5, linestyle="-", label="sine")
legend(loc='upper left')
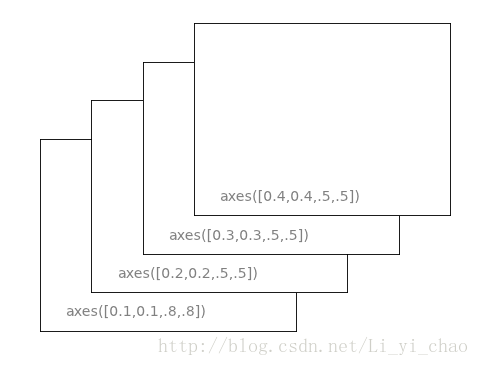
#在matplotlib中,整个图像为一个Figure对象。在Figure对象中可以包含一个,或者多个Axes对象。每个Axes对象都 是一个拥有自己坐标系统的绘图区域。(axes[左, 下, 宽, 高] )
plt.axes([0.2, 0.6, .2, .2], axisbg='y')
4种线性 : - 实线 --虚线 -.点划线 :点线
23种点形状:
"."point","pixel"o"circle"v"triangle_down"^"triangle_up"<"triangle_left">"triangle_right"1"tri_down
"2"tri_up"3"tri_left"4"tri_right"8"octagon
"s"square"p"pentagon"*"star"h"hexagon1"H"hexagon2
"+"plus"x"x"D"diamond"d"thin_diamond
# 创建一个 8 * 6 点(point)的图,并设置分辨率为 80
figure(figsize=(8,6), dpi=80)
plt.figure(1) # 第一张图
plt.subplot(211) # 第一张图中的第一张子图
plt.xlabel('Smarts')
plt.ylabel('Probability')
#添加标题
plt.title('Histogram of IQ')
#添加文字
plt.text(60, .025, r'$\mu=100,\ \sigma=15$')
#图中任意位置(60, .025)添加文字
plt.axis([40, 160, 0, 0.03])
#设置坐标大小,或x,y分别设置
xlim(-4.0,4.0)
ylim(-4.0,4.0)
xmin ,xmax = X.min(), X.max()
ymin, ymax = Y.min(), Y.max()
dx = (xmax - xmin) * 0.2
dy = (ymax - ymin) * 0.2
xlim(xmin - dx, xmax + dx)
ylim(ymin - dy, ymax + dy)
#横纵坐标起始终止位置
xticks([-np.pi, -np.pi/2, 0, np.pi/2, np.pi],[r'$-\pi$', r'$-\pi/2$', r'$0$', r'$+\pi/2$', r'$+\pi$'])
或 xticks(np.linspace(-4,4,9,endpoint=True))
yticks([-1, 0, +1], [r'$-1$', r'$0$', r'$+1$'])
# 设置轴记号,轴记号的标签
plt.annotate('local max', xy=(2, 1), xytext=(3, 1.5),arrowprops=dict(facecolor='black', shrink=0.05),)
#用来注释图中的一些特征,要考虑两个点的坐标:被注释的地方xy(x, y)和插入文本的地方xytext(x, y)。
#plt.legend()添加图例plot(X, C, color="blue", linewidth=2.5, linestyle="-", label="cosine")
plot(X, S, color="red", linewidth=2.5, linestyle="-", label="sine")
legend(loc='upper left')
#在matplotlib中,整个图像为一个Figure对象。在Figure对象中可以包含一个,或者多个Axes对象。每个Axes对象都 是一个拥有自己坐标系统的绘图区域。(axes[左, 下, 宽, 高] )
plt.axes([0.2, 0.6, .2, .2], axisbg='y')
plt.grid(True) #格子
figure参数
参数 默认值 描述
num 1 图像的数量
figsize figure.figsize 图像的长和宽(英寸)
dpi figure.dpi 分辨率(点/英寸)
facecolor figure.facecolor 绘图区域的背景颜色
edgecolor figure.edgecolor 绘图区域边缘的颜色
frameon True 是否绘制图像边缘