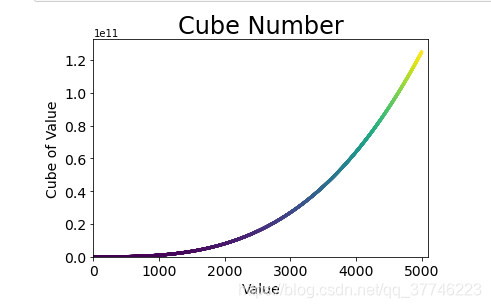
5000个数的立方,用颜色映射
import matplotlib.pyplot as plt
x_value = list(range(1,5001))
y_value = [x*x*x for x in x_value]
plt.scatter(x_value, y_value, s = 10, c = y_value, cmap = plt.cm.viridis,
           edgecolor = 'none')
plt.title("Cube Number", fontsize = 24)
plt.xlabel("Value", fontsize = 14)
plt.ylabel("Cube of Value", fontsize = 14)

plt.tick_params(axis = 'both', which = 'major', labelsize = 14)

plt.axis([0, 5100, 0, 132651000000])

plt.show()
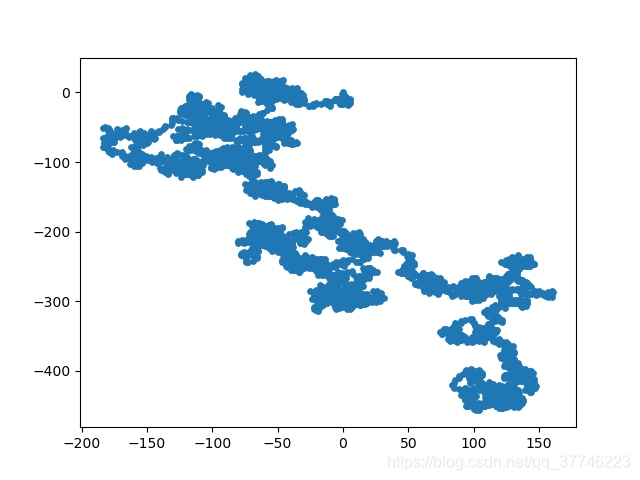
随机漫步
rw.visual.py
import matplotlib.pyplot as plt

from random_walk import RandomWalk

#创建一个RandomWalk的实例,并将其包含的点都绘制出来
rw = RandomWalk()
rw.fill_walk()
plt.scatter(rw.x_values, rw.y_values, s=15)
plt.show()
random_walk.py
from random import choice

class RandomWalk():
    """一个生成随机漫步的属性"""

    def __init__(self, num_points = 5000):
        self.num_points = num_points

        #所有随机漫步都始于(0,0)
        self.x_values = [0]
        self.y_values = [0]

    def fill_walk(self):
        """计算随机漫步包含的所有点"""

        #不断漫步,直到列表达到指定的长度
        while len(self.x_values) < self.num_points:

            #决定前进方向以及沿着这个方向前进的距离
            x_direction = choice([1, -1])
            x_distance = choice([0, 1, 2, 3, 4])
            x_step = x_direction * x_distance

            y_direction = choice([1, -1])
            y_distance = choice([0, 1, 2, 3, 4])
            y_step = y_direction * y_distance

            #拒绝原地踏步
            if x_step == 0 and y_step == 0:
                continue

            #计算下一个点的x和y的值
            next_x = self.x_values[-1] + x_step
            next_y = self.y_values[-1] + y_step

            self.x_values.append(next_x)
            self.y_values.append(next_y)
多次运行可以发现每次结果不尽相同
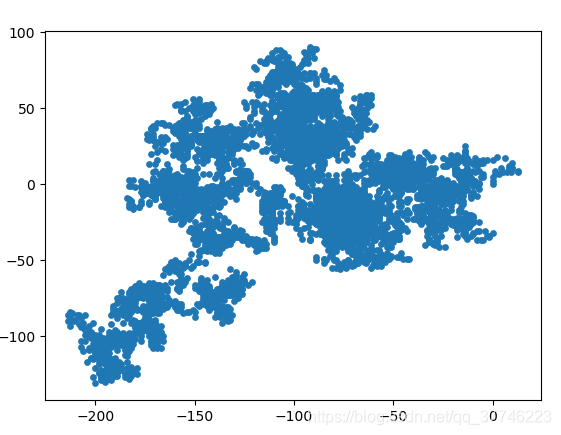
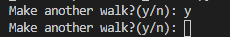
可以使用一个循环,来询问时候生成新图片,每次关闭掉图片的窗口在终端就会询问是否继续
import matplotlib.pyplot as plt

from random_walk import RandomWalk

while True:
    #创建一个RandomWalk的实例,并将其包含的点都绘制出来
    rw = RandomWalk()
    rw.fill_walk()
    plt.scatter(rw.x_values, rw.y_values, s=15)
    plt.show()

    keep_running = input("Make another walk?(y/n): ")
    if keep_running == 'n':
        break
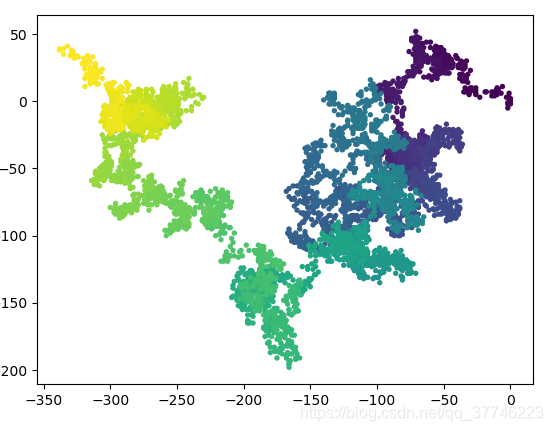
应用之前的渐变色
point_numbers = list(range(rw.num_points))
    plt.scatter(rw.x_values, rw.y_values, c = point_numbers, cmap = plt.cm.viridis,edgecolors='none', s = 15)
 显示起点和终点
#突出起点和终点
    plt.scatter(0 , 0, s = 100, c = 'red')
    plt.scatter(rw.x_values[-1] , rw.y_values[-1], s = 100, c = 'black')
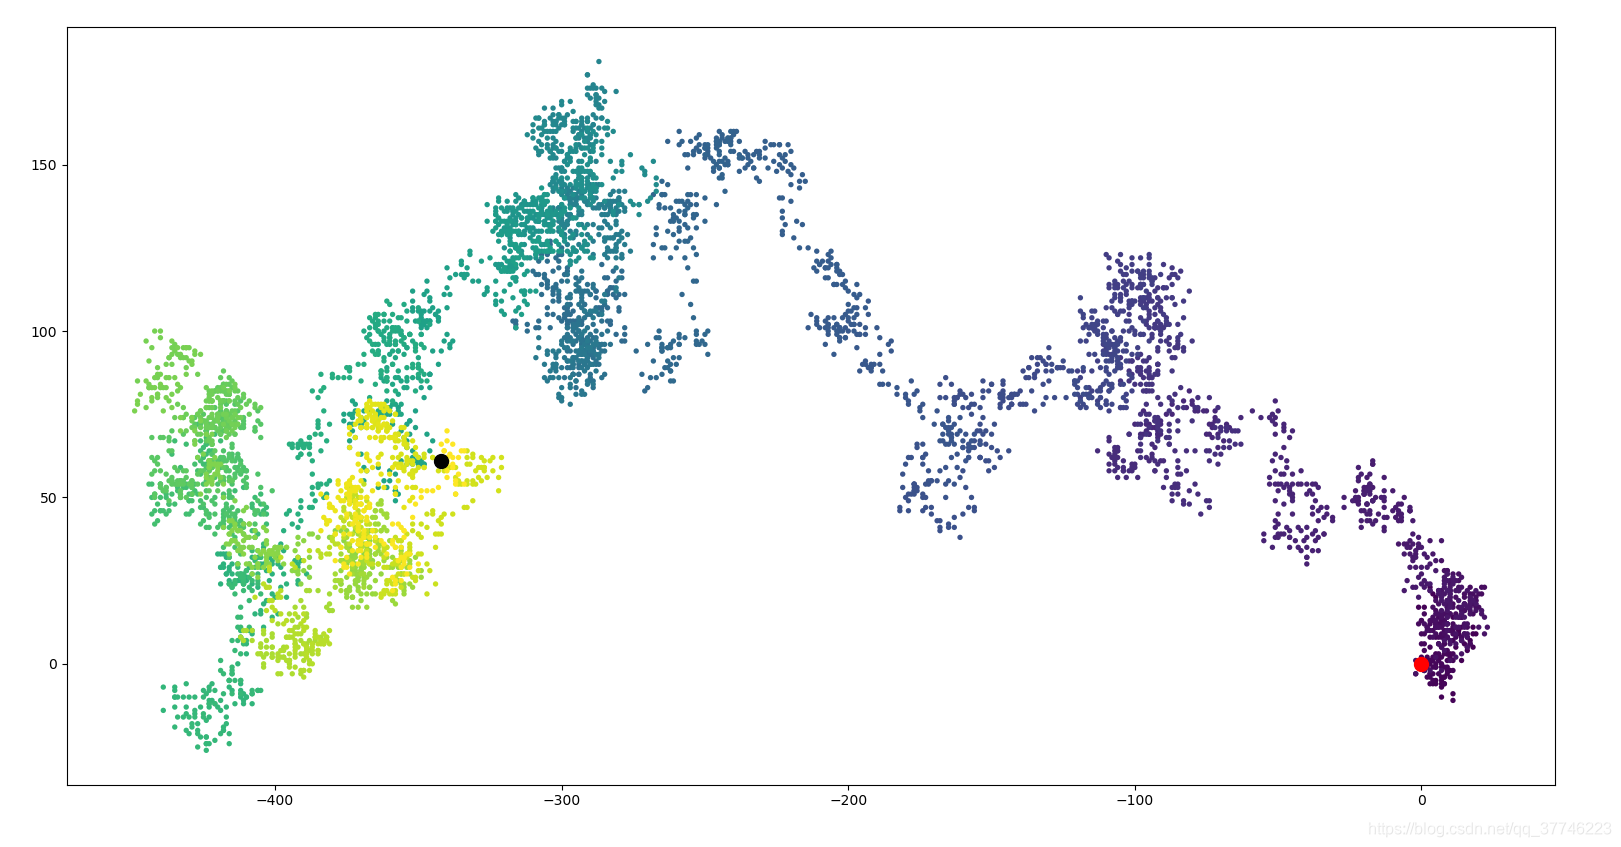 设置绘图窗口的尺寸
plt.figure(figsize=(10,6))
