ELK部分文章是需要配套一起看才可以完整了解这块的搭建使用,目前文档将搭建和使用分篇来介绍,通过ELK文档中入口来找到你想要的部分内容。
APM服务分为两部分,服务端 apm-server服务端,独立部署服务,用于收集客户端发送过来的监控信息,另一部分是apm客户端,需要集成到相应的服务代码里,目前官网提供了各种各样的接入demo.这块代码入侵性小,无需代码改造,就java而言,只需要调整启动参数,加一个java代理即可,原业务代码可以不做任何改动。
目前对此的研究和验证不多,生产环境使用APM对于系统本身性能的影响还未验证,如有必要建议做压力测试的对比。这部分内容适用于rest接口服务效果会更好,针对目前我的业务里rpc类型的接口居多,rest类型的接口较少,很多功能的用处都体现不出来,对我的系统来说这个功能不是那么强大,但是不可否认,服务的状态监控上这个是没问题的。
apm-server安装指南
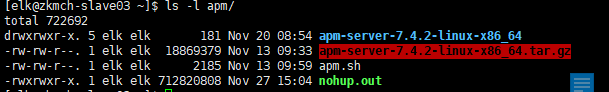
apm-server解压安装包
cd /home/elk/apm
tar -xvf apm-server-7.4.2-linux-x86_64.tar.gz # 解压文件到当前目录,可以通过 -C 来指定解压目录
apm-server配置属性apm-server.yml
完整的样例(针对修改的部分内容提供,默认的内容就不粘贴)
################################################ APM Server ################################################

apm-server:
  # Defines the host and port the server is listening on. Use "unix:/path/to.sock" to listen on a unix domain socket.
  #apm服务端对外提供http访问ip,端口 目前apm-server本身不支持集群,可以通过反向代理的服务来实现
  host: "ip:8200"

  #允许在kibana中对apm客户端的配置做调整
  kibana:
    # For APM Agent configuration in Kibana, enabled must be true.
    #enabled: false
    enabled: true

    # Scheme and port can be left out and will be set to the default (`http` and `5601`).
    # In case you specify an additional path, the scheme is required: `http://localhost:5601/path`.
    # IPv6 addresses should always be defined as: `https://[2001:db8::1]:5601`.
    #host: "localhost:5601"
    #配置对应kibana的访问地址,
    host: "ip:5601"
下面重要片段
index-lifecycle-management(ILM)策略,自定义索引规则详细描述见Filebeat部分描述
#================================= Template =================================

# A template is used to set the mapping in Elasticsearch.
# By default template loading is enabled and the template is loaded.
# These settings can be adjusted to load your own template or overwrite existing ones.

# Set to false to disable template loading.
setup.template.enabled: true

# Template name. By default the template name is "apm-%{[observer.version]}"
# The template name and pattern has to be set in case the elasticsearch index pattern is modified.
setup.template.name: "apm-%{[observer.version]}"

# Template pattern. By default the template pattern is "apm-%{[observer.version]}-*" to apply to the default index settings.
# The first part is the version of apm-server and then -* is used to match all daily indices.
# The template name and pattern has to be set in case the elasticsearch index pattern is modified.
setup.template.pattern: "apm-%{[observer.version]}-*"


#================================ Outputs =================================

# Configure the output to use when sending the data collected by apm-server.

#关闭iml策略
setup.ilm.enabled: false
#-------------------------- Elasticsearch output --------------------------
output.elasticsearch:
  # Array of hosts to connect to.
  # Scheme and port can be left out and will be set to the default (`http` and `9200`).
  # In case you specify and additional path, the scheme is required: `http://localhost:9200/path`.
  # IPv6 addresses should always be defined as: `https://[2001:db8::1]:9200`.
  # hosts: ["localhost:9200"]
  hosts: ["http://ip:9200","http://ip:9200"]
  index: "apm-%{[observer.version]}-%{+yyyy.MM.dd}"
apm-server服务启动
cd apm-server-7.4.2-linux-x86_64

#非后台启动服务方式
./apm-server -e -c apm-server.yml


#后台启动服务方式
nohup ./apm-server -e -c apm-server.yml &
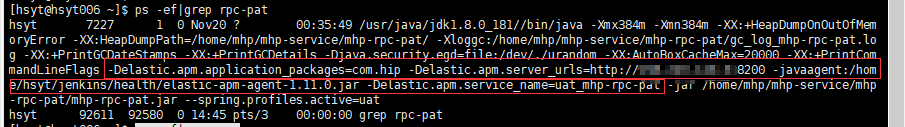
apm-server服务运行情况检查
#查看服务进程
ps -ef|grep apm-server

#日志信息查看
nohup 方式启动以后原先控制台的日志输出在运行脚本的目录下的nohup.out文件

tail -fn200 /home/elk/apm/nohup.out


apm agent安装指南
这里以java语言为例
- mavan中央仓库下载apm-agent jar包
- 增加启动参数demo
java \
 -javaagent:/.../elastic-apm-agent-<version>.jar\
 -Delastic.apm.service_name=my-application\
 -Delastic.apm.server_urls=http://localhost:8200\
 -Delastic.apm.application_packages=org.example\
 -jar my-application.jar
APM在Kibana上的相关界面
找到APM菜单

APM主页面
默认显示的是目前服务列表,列表不支持分页显示,搜索框部分的使用都是通用的,和其他模块里的类似

搜索输入框
时间输入框
Filters
APM几乎所有页面左侧都有一块Filters 内容,此处是一部分下拉选择类型的过滤项,用于数据过滤,支持手动输入动态匹配

Setting(beta内测功能)


APM某个监控服务详情页面
Transaction 列表页面

Transaction 详情页面

Transaction 详细Timeline
目前这个只能针对当前服务本身的一些流程来统计耗时,涉及到调用第三方接口的部分目前无法统计

Errors 列表页

Errors 详情页
某条错误记录的详情

某条错误记录的详情Metadata

Metrics监控信息图表页

参考资料
这篇文章绝大多数内容都是从官网的开发文档中找到依据,少量的参考其他资料,结合实际验证而来.官网的相关资料都在上文相应的位置做了链接,此处不再重复列举,提供一个官网地址涵盖全部官网的参考资料。
