上一篇介绍了nginx cache的配置[使用nginx cache加速H5加载速度],及通过分析访问日志来实现缓存命中率的统计,因为笔者使用的是openresty,后来想到不如使用ngx.shared.DICT 用lua脚本实时统计更方便,使用zabbix 进行采集,做成一体化。
36.4.49.117 - [31/Jan/2018:13:17:14 +0800] "GET /page/140019?code=nLfrSW&time=1517338888000
HTTP/1.1" 200 9848 "https://xxxxxx"
"Mozilla/5.0 (Linux; Android 5.0.2; vivo Y33 Build/LRX21M; wv) AppleWebKit/537.36
(KHTML, like Gecko) Version/4.0 Chrome/57.0.2987.132 MQQBrowser/6.2
TBS/043906 Mobile Safari/537.36 MicroMessenger/6.6.1.1220(0x26060135) NetType/WIFI Language/zh_CN" "36.4.49.117" "-" "-" "-" "0.001" "HIT"
使用access log统计太low,不实时,而且速度慢,当然有离线的优势,不用引入其他模块。
闲话休述,进入正题。
openresty 配置
lua脚本如下:
local cache = ngx.shared.cache_stat
local upstream_cache_status = ngx.var.upstream_cache_status;
local newval, err = cache:incr(upstream_cache_status,1)
if not newval and err == "not found" then
cache:add(upstream_cache_status,1)
end
local total = "TOTAL"
local newval1, err1 = cache:incr(total,1)
if not newval1 and err1 == "not found" then
cache:add(total, 1)
end
cache:incr是atomic操作,不会丢失,放在openresty配置文件中是摘个样子:
#使用1m内存(有点浪费,只有几个metric,可以改为10k这种)
lua_shared_dict cache_stat 1m;server {
......location /page {
proxy_cache page_cache;
proxy_cache_key $scheme$uri?code=$arg_code&time=$arg_time;
proxy_cache_valid 200 5d;
log_by_lua 'local cache = ngx.shared.cache_stat
local upstream_cache_status = ngx.var.upstream_cache_status;
local newval, err = cache:incr(upstream_cache_status,1)
if not newval and err == "not found" then
cache:add(upstream_cache_status,1)
end
local total = "TOTAL"
local newval1, err1 = cache:incr(total,1)
if not newval1 and err1 == "not found" then
cache:add(total, 1)
end
'
}
}
当然脚本也可以放到一个独立的文件中,使用log_by_lua_file指定文件路径,显得简洁些。
写一个location,对外开放,用来实时采集统计:
location /cache-status {
allow 127.0.0.1;
deny all;
default_type 'text/plain' ;
content_by_lua '
local cache = ngx.shared.cache_stat
local keys = cache:get_keys()
for idx, key in pairs(keys) do
ngx.say(key .. " " .. cache:get(key))
end
local hit = cache:get("HIT")
local total = cache:get("TOTAL")
ngx.say("RATIO ".. string.format("%.2f", hit * 100/total))
';}
测试一把就是摘个样子:
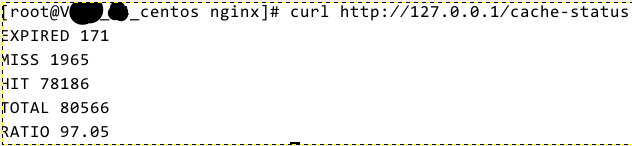
Zabbix 监控采集配置
在这台openresty机器的zabbix agent的scripts目录新建脚本ngx_cache_stat.sh,内容咋个样子:
#!/bin/bash
HOST=127.0.0.1
PORT=80
# Functions to return cache stats
function hit {
/usr/bin/curl "http://$HOST:$PORT/cache-status" 2>/dev/null| grep 'HIT' | awk '{print $2}'
}
function miss {
/usr/bin/curl "http://$HOST:$PORT/cache-status" 2>/dev/null| grep 'MISS' | awk '{print $2}'
}
function expired {
/usr/bin/curl "http://$HOST:$PORT/cache-status" 2>/dev/null| grep 'EXPIRED' | awk '{print $2}'
}
function updating {
/usr/bin/curl "http://$HOST:$PORT/cache-status" 2>/dev/null| grep 'UPDATING' | awk '{print $2}'
}
function stale {
/usr/bin/curl "http://$HOST:$PORT/cache-status" 2>/dev/null|grep 'STALE' | awk '{print $2}'
}
function bypass {
/usr/bin/curl "http://$HOST:$PORT/cache-status" 2>/dev/null|grep 'BYPASS' | awk '{print $2}'
}
function ratio {
/usr/bin/curl "http://$HOST:$PORT/cache-status" 2>/dev/null|grep 'RATIO' | awk '{print $2}'
}
$1
upstream_cache_status包含以下几种状态:
- ·MISS 未命中,请求被传送到后端
- HIT 缓存命中
- EXPIRED 缓存已经过期请求被传送到后端
- UPDATING 正在更新缓存,将使用旧的应答
- ·STALE 将得到过期的应答
- ·BYPASS 穿透缓存,进入后端
测试下:
sh ngx_cache_stat.sh hit有数字内容输入代表ok了,
在Zabbix Agent HOME 的 etc/zabbix_agentd.conf.d/中新建文件ngx_cache_stat.conf,内容如下
#ngx_cache_stat.conf
Timeout=10
UnsafeUserParameters=1
UserParameter=nginx.cache.status[*],/usr/local/zabbix/script/ngx_cache_stat.sh $1
重启zabbix-agentd,
killall zabbix_agentdzabbix server执行:zabbix_get测试下
./zabbix_get -s 10.0.x.x -k nginx.cache.status[ratio]得到正确值就ok了。
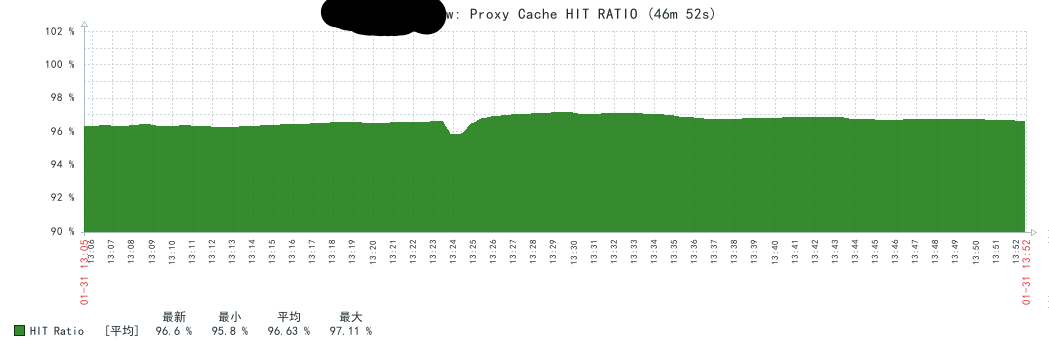
从github获取zabbix模板,导入zabbix中,
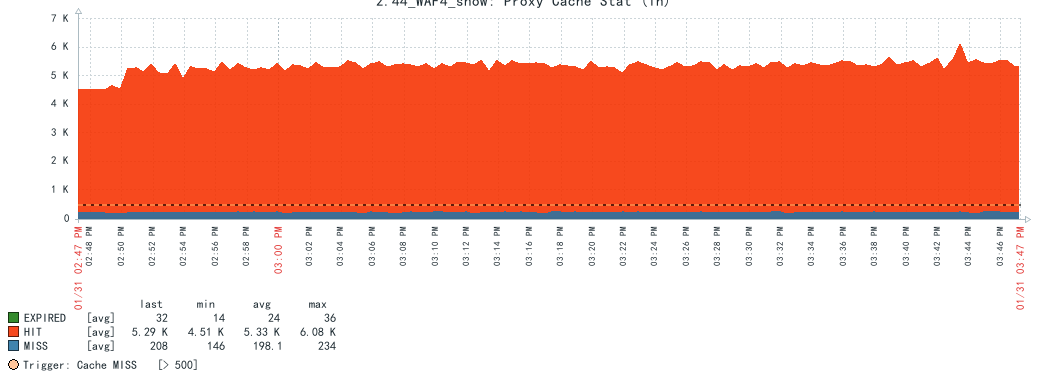
采集开始后监控信息如下,缓存命中率95%左右
以下监控的是HIT,MISS,EXPIRED的增量值(30秒)
所有脚本和模板在github:
请作者喝咖啡: