一、 实验目的
- 了解DBSCAN算法基本原理;
- 编写代码并实现DBSCAN算法对数据的聚簇
二、 实验步骤
- 采用的数据集 :R语言factoextra包里的multishapes数据集

- 函数首先确定两个参数:
(1)epsilon:在一个点周围邻近区域的半径
(2)minPts:邻近区域内至少包含点的个数
根据以上两个参数,可以把样本中的点分成三类:
核点:满足领域内的点>=minPts,则为核样本点
边界点:满足领域内的点<minPts,但是该点可由一些核点获得
噪声点:既不是核点也不是边缘点,则是不属于这一类的点
- 用欧式距离计算点与点之间的距离矩阵disMatrix
- 为数据集添加visited列,0表示未访问,1表示访问过
- 判断点的类型存放到data_N
- 删除噪声点存放到data_C
- 重新计算距离,合并有交集的领域
- 为不同类型的点标签
- 绘图
三、 实验代码
library(factoextra)
library(ggplot2)

data<-data.frame(multishapes[,1:2])

ggplot(data,aes(x,y))+geom_point()

#主函数
DBSCAN = function(data,eps,MinPts){

rows = nrow(data)
disMatrix<-as.matrix(dist(data, method = "euclidean"))#求距离

data$visited <- rep(0,rows)
names(data)<-c("x","y","visited")

data_N = data.frame(matrix(NA,nrow =rows,ncol=3)) #领域集N,存放索引、领域内的点数、点的类型
names(data_N)<-c("index","pts","cluster")

#判断点的类型,1核心点,2边界点,0噪声点

for(i in 1:rows){
  if(data$visited[i] == 0){ #未被访问的点
    data$visited[i] = 1  #标记已经被访问
    index <- which( disMatrix[i,] <= eps)
    pts <- length(index)


     if(pts >= MinPts){
      data_N[i,]<-c(i,pts,"1")
    }else if(pts>1 && pts< MinPts){
      data_N[i,]<-c(i,pts,"2")
    }else{
      data_N[i,]<-c(i,pts,"0")
    }
  }
}

   #删除噪声点
  data_C<-data[which(data_N$cluster!=0),]

  #去掉噪声点之后的领域
  disMatrix2<-as.matrix(dist(data_C, method = "euclidean"))
  Cluster<-list()
  for(i in 1:nrow(data_C)){
    Cluster[[i]]<-names(which(disMatrix2[i,]<= eps))
  }

#合并有交集的邻域,生成一个新簇

  for(i in 1:length(Cluster)){
    for(j in 1:length(Cluster)){
      if(i!=j && any(Cluster[[j]] %in% Cluster[[i]])){
        if(data_N[Cluster[[i]][1],]$cluster=="1"){
          Cluster[[i]]<-unique(append(Cluster[[i]],Cluster[[j]])) #合并,删除重复
          Cluster[[j]]<-list()
        }
      }
    }
  }

  newCluster<-list()       #去掉空列表
  for(i in 1:length(Cluster)){
    if(length(Cluster[[i]])>0){
      newCluster[[length(newCluster)+1]]<-Cluster[[i]]
    }
  }

  #为相同簇中的对象赋相同的标签


  data_C[,4]<-as.character()
  for(i in 1:length(newCluster)){
    for(j in 1:length(newCluster[[i]])){
      data_C[newCluster[[i]][j],4]<-i
    }

  }
  return(data_C)
}


  #运行
test<-DBSCAN(data,0.15,6)  #设定eps为0.15,minpts为6


ggplot(test,aes(x,y,colour=factor(test[,4])))+
  geom_point(shape=factor(test[,4]))
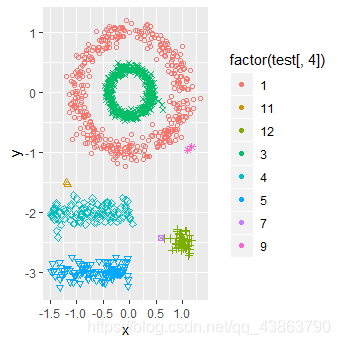
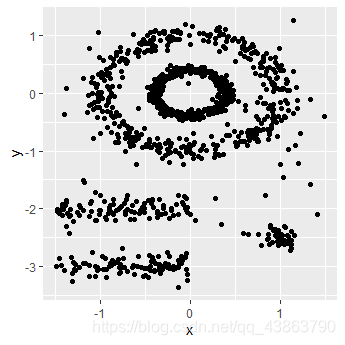
四、 运行结果
原数据
经过聚类后