python中需要在一定区间内进行采样,或是对生成的数据进行采样,可以利用随机模块
random.sample()函数或者numpy.random.choice()函数实现。
1.随机采样
如果需要对某个区间内的数进行随机采样,可以使用random.sample()来实现。
random.sample(N, m)函数主要有两个参数,分别是需要采样的序列N和需要采样的样本个数m。
import random
N = range(10)
m = 3
a = random.sample(N, m)
print(a)
# 从0~9的序列中采样了3个样本
>>> [0, 5, 8]
numpy中的随机数模块同样可以进行采样,可以利用numpy.random.choice()函数实现。numpy.random.choice(a, size=None, replace=True, p=None)主要有四个参数,其中a为一维待采样序列,size为采样样本数目,replace代表是否重复采样,p如果设置的话与a等长代表序列中每个位置的采样概率。
import numpy as np
N = range(10)
m = 3
a = np.random.choice(N, size=3)
b = np.random.choice(N, size=6)
c = np.random.choice(N, size=9)
print("a:",a)
print("b:",b)
print("c:",c)
#输出结果
>>>
'a:', array([5, 9, 7])
'b:', array([5, 5, 1, 3, 4, 3])
'c:', array([5, 8, 4, 4, 0, 4, 8, 2, 2])   # 可以看到这里有重复的采样数字

#----- 不重复采样,需要设置replace -----#
a = np.random.choice(N, size=3, replace=False)
b = np.random.choice(N, size=6, replace=False)
c = np.random.choice(N, size=9, replace=False)
print("a:",a)
print("b:",b)
print("c:",c)
#输出结果
>>>
a = np.random.choice(N, size=3, replace=False)
b = np.random.choice(N, size=6, replace=False)
c = np.random.choice(N, size=9, replace=False)
print("a:",a)
print("b:",b)
print("c:",c)
>>>
'a:', array([7, 5, 3])
'b:', array([3, 7, 4, 8, 9, 1])
'c:', array([2, 1, 7, 6, 0, 5, 9, 4, 3])

#----- 设置采样概率p -----#
c = np.random.choice(N, size=9, p=[0.1,0.1,0.01,0.1,0.09,0.01,0.4,0.09,0.05,0.05])  #6的位置概率最大
print('c:', c)
>>>
'c:', array([6, 7, 0, 3, 6, 6, 6, 4, 3])      #可以看到6出现的概率明显增加
2.二维采样
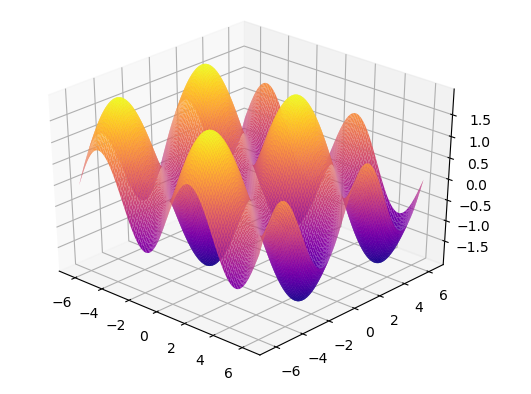
有的时候我们还需要进行二维采样,例如对一个表面进行采样、对图像进行采样、或者对深度进行采样,这在图像处理中十分有用。下面用一个二维曲面的采样作为例子进行说明。
import numpy as np
import matplotlib.pyplot as plt
from mpl_toolkits.mplot3d import Axes3D

# make datas, generate surface
surface_range = 2*np.pi  # range of surface
num = 128    #x,y number point
x = np.linspace(-surface_range, surface_range, num)
y = np.linspace(-surface_range, surface_range, num)
[X, Y] = np.meshgrid(x,y)

Z = np.sin(X) + np.sin(Y) + 1e-3   # generated surface


# draw surface
fig = plt.figure()
ax = fig.gca(projection='3d')
# Plot the surface.
surf = ax.plot_surface(X, Y, Z,cmap='plasma', rstride = 1, cstride = 1)
plt.show()
随后我们在这个表面上采样500个点,使用nump.random.choice()进行。
samp_nums = 500
surface_list = range(Z.size)
samp_list = np.random.choice(surface_list, samp_nums, replace=False) # 从Z所有的表面点中选取500个采样点
print(len(samp_list))
# 选出了samp_nums个采样点
>>> 500
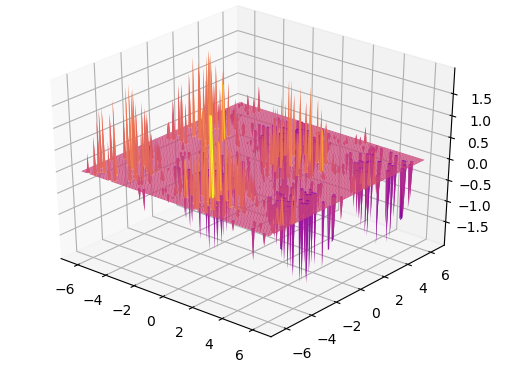
# 将采样值作为surface索引值进行采样
samp_1D_array = np.zeros(Z.size) # 1.首先构建一个长度为曲面点数目的一维序列
samp_1D_array[samp_list] = 1 # 2.随后将一维序列中的采样位置设置为1
samp_2D_array = np.reshape(samp_1D_array, Z.shape) # 随后转换为与曲面相同尺寸的采样矩阵
sample_surface = Z * samp_2D_array # 最后进行采样,得到采样后曲面
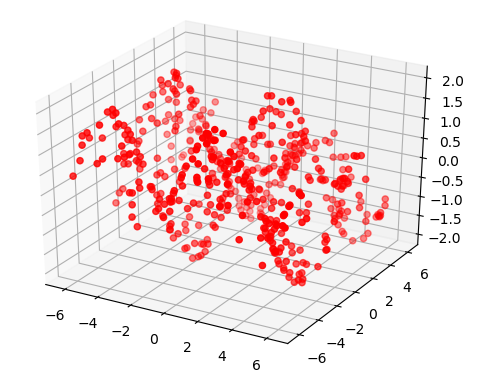
# 如果想要得到逐个采样点,可以从X,Y,Z中读取相应位置的值
sample_Z = Z[np.where(samp_2D_array==1)]
sample_Y = Y[np.where(samp_2D_array==1)]
sample_X = X[np.where(samp_2D_array==1)]

fig = plt.figure()
ax = fig.gca(projection='3d')
ax.plot_surface(X, Y, Z,cmap='plasma', rstride = 1, cstride = 1)
ax.scatter3D(sample_X,sample_Y,sample_Z,zdir='z',c='r')
plt.show()
采样点和被采样表面:
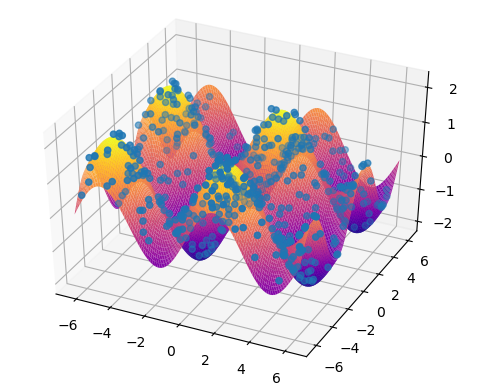
最终就可以完成采样。如果还需要进行插值可以参考scipy.interpolate.griddata()函数。
Fancy Index:https://jakevdp.github.io/PythonDataScienceHandbook/02.07-fancy-indexing.html random:https://blog.csdn.net/qq_32364939/article/details/78443751 random.sample:https://blog.csdn.net/sunnyyan/article/details/83410233 np.random:https://blog.csdn.net/zsc201825/article/details/80918450 np.random.choice:https://docs.scipy.org/doc/numpy-1.15.0/reference/generated/numpy.random.choice.html
python standard libs:https://docs.python.org/3.4/library/index.html
matplotlib scatter:https://matplotlib.org/mpl_examples/mplot3d/scatter3d_demo.py
https://blog.csdn.net/Scc_hy/article/details/81455795
https://www.zhihu.com/question/46673934/answer/102286003
colormap:https://matplotlib.org/3.1.1/gallery/color/colormap_reference.html
matplotlib palettable: https://jiffyclub.github.io/palettable/

