闲话少絮,步入正题:
官网api文档直通https://www.echartsjs.com/zh/api.html#echarts
一.下载安装echarts
执行以下命令,安装echarts
npm install echarts -S

// 打印日志如下:
$ npm install echarts -S
npm WARN [email protected] requires a peer of ajv@^6.0.0 but none is installed. You must install peer dependencies yourself.
npm WARN [email protected] requires a peer of @babel/core@^7.0.0 but none is installed. You must install peer dependencies yourself.
npm WARN [email protected] requires a peer of eslint@>=5.0.0 but none is installed. You must install peer dependencies yourself.
npm WARN [email protected] requires a peer of eslint-plugin-node@>=7.0.0 but none is installed. You must install peer dependencies yourself.
npm WARN [email protected] requires a peer of eslint-plugin-promise@>=4.0.0 but none is installed. You must install peer dependencies yourself.
npm WARN [email protected] requires a peer of eslint-plugin-standard@>=4.0.0 but none is installed. You must install peer dependencies yourself.
npm WARN optional SKIPPING OPTIONAL DEPENDENCY: [email protected] (node_modules\fsevents):
npm WARN notsup SKIPPING OPTIONAL DEPENDENCY: Unsupported platform for [email protected]: wanted {"os":"darwin","arch":"any"} (current: {"os":"win32","arch":"x64"})

+ [email protected]
added 2 packages in 39.64s
二.在项目中的main.js中添加如下代码:
import echarts from 'echarts'
Vue.prototype.$echarts = echarts
三.新建echarts-demo.vue:
<template>
<div>
<div id="echartsDemo" style="width: 500px;height: 500px;"></div>
<div id="echartsBarDemo" style="width: 500px;height: 500px;"></div>
</div>
</template>
<script>
export default {
data () {
return {
content: ''
}
},
mounted () {
this.drawLine()
this.drawBar()
},
methods: {
drawLine () {
let elementById = document.getElementById('echartsDemo')
let echartsDemo = this.$echarts.init(elementById)
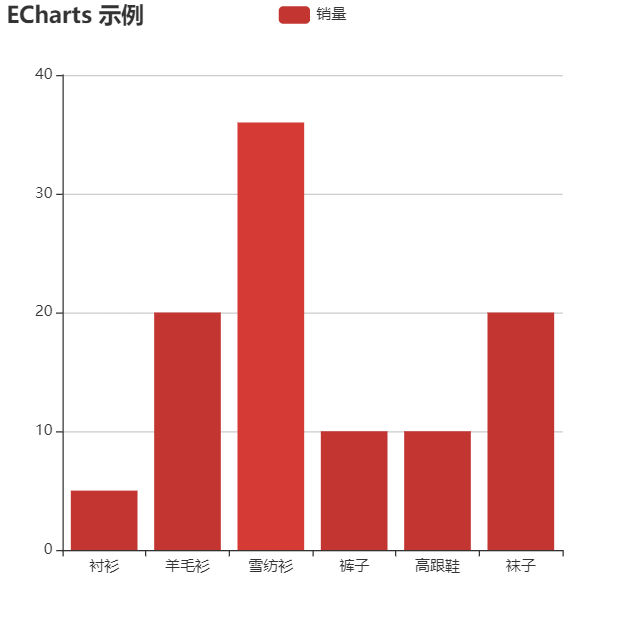
let option = {
title: {
text: 'ECharts 示例'
},
tooltip: {},
legend: {
data: ['销量']
},
xAxis: {
data: ['衬衫', '羊毛衫', '雪纺衫', '裤子', '高跟鞋', '袜子']
},
yAxis: {},
series: [{
name: '销量',
type: 'bar',
data: [5, 20, 36, 10, 10, 20]
}]
}
echartsDemo.setOption(option)
},
drawBar () {
let echartsBarDemo = this.$echarts.init(document.getElementById('echartsBarDemo'))
echartsBarDemo.setOption({
backgroundColor: '#2c343c',
title: {
text: 'Customized Pie',
left: 'center',
top: 20,
textStyle: {
color: '#ccc'
}
},
tooltip: {
trigger: 'item',
formatter: '{a} <br/>{b} : {c} ({d}%)'
},
visualMap: {
show: false,
min: 80,
max: 600,
inRange: {
colorLightness: [0, 1]
}
},
series: [
{
name: '访问来源',
type: 'pie',
radius: '55%',
center: ['50%', '50%'],
data: [
{ value: 335, name: '直接访问' },
{ value: 310, name: '邮件营销' },
{ value: 274, name: '联盟广告' },
{ value: 235, name: '视频广告' },
{ value: 400, name: '搜索引擎' }
].sort(function (a, b) { return a.value - b.value }),
roseType: 'radius',
label: {
normal: {
textStyle: {
color: 'rgba(255, 255, 255, 0.3)'
}
}
},
labelLine: {
normal: {
lineStyle: {
color: 'rgba(255, 255, 255, 0.3)'
},
smooth: 0.2,
length: 10,
length2: 20
}
},
itemStyle: {
normal: {
color: '#c23531',
shadowBlur: 200,
shadowColor: 'rgba(0, 0, 0, 0.5)'
}
},
animationType: 'scale',
animationEasing: 'elasticOut',
animationDelay: function (idx) {
return Math.random() * 200
}
}
]
})
}
}
}
</script>
四.显示效果如下: