文章目录
原文地址: From Java code to Java heap
从Java代码到Java堆——理解并优化你的应用的内存使用量
介绍
- 尽管优化应用代码在内存中的使用量的主题已不再新颖,但它也不是能够很好被理解的。这篇文章简要的介绍了Java进程对于内存使用,然后深入的挖掘了你所写的Java代码对于内存的使用。最后,展示了几种让你的应用代码更有效的使用内存的方法,尤其是在Java容器方面,例如HashMaps 和 ArrayLists。
背景:Java进程对于内存的使用
- 当你通过java命令或某些基于Java的中间程序运行Java应用时,Java runtime会创建一个操作系统的进程(就像你运行一个基于C语言的程序一样)。事实上,多数JVM的大部分代码都是由C/C++编写的。做为一个操作系统进程,Java进程同样也会像其他进程一样面临内存限制的问题:架构提供的内存寻址能力,以及操作系统提供的用户空间。
- 架构提供的内存寻址能力取决于处理器的位数(例如,32位或64位,或31位)。处理器的位数决定了处理器能处理的内存地址范围:32位的能处理的地址范围是 ,即4,294,967,296bits 或 4G。64位处理器的寻址范围远远更大: ,即18,446,744,073,709,551,616bits 或 16EB。
- 处理器架构提供的可寻址范围有一部分会被OS kernel和C runtime(或者由C/C++编写的JVM)使用。OS和C runtime对于内存的使用量取决于正在被使用的OS,不过通常来说:Windows的默认使用量是2G。剩余的可寻址的空间是用户空间,用于真实的进程运行时使用。
- 对于Java应用而言,用户空间是Java进程使用的内存,实际上由两个池组成:Java堆和本地堆 (non-Java) 。Java堆的大小通过JVM的参数控制:-Xms和-Xmx分别用于设置最小、最大的Java堆内存。本地堆则是在分配Java堆(最大值)后剩余的用户空间。图1 展示了32位Java进程大致样貌的示例:
- 图1. 32位Java进程的内存布局示例。
- 在图1中,OS 和 C runtime 使用了4G中约的1G的寻址范围,Java堆使用了接近2G,本地堆使用了剩余部分。需要注意的是JVM也会使用内存(和OS kernel 、C runtime使用内存的方式相同),并且JVM使用的内存是本地堆的一部分。
- 图1. 32位Java进程的内存布局示例。
Java对象剖析
- 当你在Java代码中使用new操作创建一个对象实例时,被分配的数据量将超乎你的预期。例如,int值与Integer对象的大小比例或许会使你惊奇(它们通常的比例是1 : 4) 。在此处的Integer中,额外的开销部分是JVM用于描述Java对象的元信息(metadata)。
- 对象的元信息(metadata)在不同的JVM中各有不同,不过通常由以下部分组成:
- Class : 指向描述对象类型的class的指针。在此处java.lang.Integer对象中,举例来说就是指向java.lang.Integer class的指针。
- Flags : 描述对象状况的数据集,包括hash code(如果这个对象有的话),对象的形状(用来确定对象是否是一个数组)
- Lock : 对象的同步信息——表示这个对象当前是否是synchronized
- 在对象的元信息(metadata)之后就是对象的数据本身,由存储在实例化的对象的字段组成。在此处java.lang.Integer对象中,它就是单个int。
- 因此,当你在一个32位的JVM中创建java.lang.Integer对象时,对象的布局大致如 图2:
- 图2. 32位Java进程中java.lang.Integer对象布局的示例
- 如 图2 所示,128bits的数据用于存储32bit的int值,因为对象的元信息(metadata)使用了128bits的其余部分。
- 图2. 32位Java进程中java.lang.Integer对象布局的示例
Java数组对象剖析
- 数组对象的形状、结构与标准的Java对象是相似的,例如一个int的数组。主要的不同点在于数组对象在元信息(metadata)中额外多了对数组大小的记录。一个数组对象的元信息(metadata)由以下部分组成:
- Class : 指向描述对象类型的class的指针。在此处int数组中,就是指向 int[] class的指针。
- Flags : 描述对象状况的数据集,包括hash code(如果这个对象有的话),对象的形状(用来确定对象是否是一个数组)
- Lock : 对象的同步信息——表示这个对象当前是否是synchronized
- Size : 数组的大小
- 图3 展示一个int数组对象的布局示例
- 图3. 32位Java进程中int数组对象的布局示例
- 在 图3 中,160bits的数据用于存储32bit的int值,因为数组的元信息(metadata)使用了160bits的其余部分。原始数据(byte、int、 long、a single-entry)的数组比单个字段对应的包装对象(Byte、Integer、Long)在内存中的开销更加昂贵。
- 图3. 32位Java进程中int数组对象的布局示例
更复杂的数据结构剖析
- 良好的面向对象设计与编程鼓励对于封装(提供接口用于控制数据访问)和委托 (使用辅助对象执行任务)的使用。封装和委托会导致大多数数据结构的表示需要使用多个对象。一个简单的例子就是ava.lang.String对象。java.lang.String中的数据是character数组,对其进行封装,并管理、控制对于character数组的访问。在32位Java进程中java.lang.String 对象的布局大致如 图4:
- 图4. 32位Java进程中java.lang.String 对象的布局示例
- 如 图4 所示,一个java.lang.String对象包含了标准对象的元信息(metadata),其中部分字段用于管理string数据。通常来说,这些字段包括hash值、string的长度、string的offset、对于character数组的引用。
- 图4. 32位Java进程中java.lang.String 对象的布局示例
- 这意味着为了获得一个含8 characters(128 bits)的string,需要256 bits的数据存放character数组、224 bits的数据存放用于管理它的java.lang.String对象,总共需要480 bits (60 bytes) 来表示 128 bits (16 bytes) 的数据。此时的开销比率达到了3.75:1。
- 总的来说,数据结构越复杂,开销就越高。更详细的讨论将在下一节进行。
32位与64位的Java对象
-
在先前的例子中对象的大小和开销针对的是32位的Java进程。正如你在“背景:Java进程对于内存的使用”小节所知,64位处理器相比32位处理器拥有更高级别的内存寻址性。对于64位进程,Java对象中某些数据字段的大小(特别是对象元信息和引用其他对象的任何字段)也需要增加到64位。其他数据字段类型(如int、byte和long)的大小不变。图5 展示了64位Integer对象和int数组对象的布局:
- 图5. 64位Java进程中,Integer对象和int数组对象的布局示例
- 在 图5 中,64位的Integer对象使用了224bits来存储32bits的int字段(开销比率为7:1),64位的int数组使用了288bits来存储32bits的int(开销比率为9:1)。在真实的应用中,将之前运行在32位Java runtime的应用移动到64位Java runtime,Java堆内存的使用量将会显著增加。通常来说,大约会增加之前堆大小的70%。例如,在32位Java runtime中使用了1GB堆内存的应用,切换到64位Java runtime中会使用1.7GB堆内存。
- 图5. 64位Java进程中,Integer对象和int数组对象的布局示例
-
需要注意的是内存的增加不仅限于Java堆内存。本地堆内存区域也将会增加,某些时候会多达90%。
-
表1 展示了当程序分别运行在32位、64位模式下,对象和数组的字段大小。
- 表1. 32位、64位模式下各字段大小
Field type Field size (bits) Object Array 32-bit 64-bit 32-bit 64-bit boolean32 32 8 8 byte32 32 8 8 char32 32 16 16 short32 32 16 16 int32 32 32 32 float32 32 32 32 long64 64 64 64 double64 64 64 64 Object fields 32 64 (32*) 32 64 (32*) Object metadata 32 64 (32*) 32 64 (32*) - 对象字段的大小与每个对象元信息使用的数据都可以通过“Compressed References or Compressed OOPs”技术缩减到32bits。
压缩引用与压缩普通对象指针(OOPs)
- IBM 与 Oracle JVMs 各自通过Compressed References (-Xcompressedrefs) 与 Compressed OOPs (-XX:+UseCompressedOops)设置选项提供了对象引用压缩能力。启用这些选项,能够使对象的字段、元信息使用32位的方式存储,而不是64位。当应用从32位Java runtime移动到64位Java runtime时,能够有效的降低Java堆内存70%增量的那部分。需要注意的是这个选项对本地堆的内存使用量没有影响,它在64位Java runtime时的值仍会高于32位Java runtime的值。
Java容器对于内存的使用量
- 在大多数应用中,大量的数据会通过Java容器类提供的API被存储和管理。如果内存占用的优化对你的应用来说是重要的,那么明白每个容器提供的功能与相关的内存开销是特别有用的。一般来说,容器的功能越高级,花费的内存越多(因此,使用提供的功能多于你需求的容器类型会不必要的增加内存开销)。
- 部分常用的容器如下:
- HashSet
- HashMap
- Hashtable
- LinkedList
- ArrayList
- 清单是按功能和内存开销降序排序的,HashSet除外。(HashSet作为HashMap的包装对象,实际上提供了更少的功能,花费的内存却略大)
Java容器: HashSet
- Haset是Set接口的实现。Java SE 6 API文档关于HashSet的描述如下:
A collection that contains no duplicate elements. More formally, sets contain no pair of elements e1 and e2 such that e1.equals(e2), and at most one null element. As implied by its name, this interface models the mathematical set abstraction.
A HashSet has fewer capabilities than a HashMap in that it cannot contain more than one null entry and cannot have duplicate entries. The implementation is a wrapper around a HashMap, with the HashSet object managing what is allowed to be put into the HashMap object. The additional function of restricting the capabilities of a HashMap means that HashSets have a slightly higher memory overhead. - 图6 展示了32位Java runtime 中HashSet的内存使用量与布局
- 图6. 32位Java runtime 中HashSet的内存使用量与布局
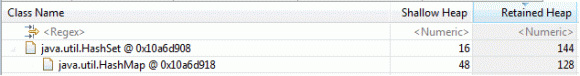
- 图6 展示了java.util.HashSet对象的shallow heap(对象自身的内存使用量)的byte值,以及 retained heap(对象自身内存与其子引用对象的内存使用量)的byte值。shallow heap的大小是16 bytes,retained heap 的大小是144 bytes。当HashSet被创建时,它的容量是16(实体对象可以放入set的数据)。当HashSet使用默认容量创建,并且未放入实体对象时,它会占用144 bytes。它比HashMap会额外使用16 bytes。表2 展示了一个HashSet的属性:
- 表2. HashSet的属性
Attribute Description Default capacity 16 entries Empty size 144 bytes Overhead 16 bytes plus HashMapoverheadOverhead for a 10K collection 16 bytes plus HashMapoverheadSearch/insert/delete performance O(1) — Time taken is constant time, regardless of the number of elements (assuming no hash collisions) - 图6. 32位Java runtime 中HashSet的内存使用量与布局
Java容器: HashMap
- HashMap是Map接口的实现。Java SE 6 API文档关于HashMap的描述如下:
An object that maps keys to values. A map cannot contain duplicate keys; each key can map to at most one value.
HashMap provides a way of storing key/value pairs, using a hashing function to transform the key into an index into the collection where the key/value pair is stored. This allows for fast access to the data location. Null entries and duplicate entries are allowed; as such, a HashMap is a simplification of a HashSet. - HashMap的由HashMap$Entry数组对象实现。图7 展示了32位Java runtime 中HashMap的内存使用量与布局
- 图7. 32位Java runtime 中HashMap的内存使用量与布局
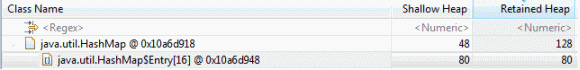
- 如 图7 所示,当HashMap被创建时,其结果包括HashMap对象与默认容量为16的HashMap$Entry数组对象。当HashMap完全是空的时候,其大小为128 bytes。任何键/值对都会通过HashMap$Entry进行包装后,再插入HashMap,同时HashMap$Entry自身也会有一些开销。
- 图7. 32位Java runtime 中HashMap的内存使用量与布局
- HashMap$Entry主要由以下字段实现:
- int KeyHash
- Object next
- Object key
- Object value
- 一个32 byte的HashMap$Entry对象管理着被插入容器的键/值对数据。这意味着HashMap全部的开销由HashMap对象、HashMap$Entry数组、HashMap$Entry对象组成。可以用如下的公式表示:
HashMap object + Array object overhead + (number of entries * (HashMap$Entry array entry + HashMap$Entry object)) - 对于拥有1000个entry的HashMap,仅仅HashMap对象、HashMap$Entry数组、HashMap$Entry对象的开销就约达360K。这是keys和values被存入之前的大小。
- 表3 展示了一个HashMap的属性:
- 表3. HashMap的属性
Attribute Description Default capacity 16 entries Empty size 128 bytes Overhead 64 bytes plus 36 bytes per entry Overhead for a 10K collection ~360K Search/insert/delete performance O(1) — Time taken is constant time, regardless of the number of elements (assuming no hash collisions)
Java容器: Hashtable
- 如同HashMap,Hashtable也是Map接口的实现。Java SE 6 API文档关于Hashtable的描述如下:
This class implements a hashtable, which maps keys to values. Any non-null object can be used as a key or as a value.
Hashtable is very similar to HashMap, but it has two limitations. It cannot accept null values for either the key or the value entries, and it is a synchronized collection. In contrast, HashMap can accept null values and is not synchronized but can be made synchronized using the Collections.synchronizedMap() method. - Hashtable由Entry数组对象实现(与HashMap相似),在此处是Hashtable$Entry对象。图8 展示了32位Java runtime 中Hashtable的内存使用量与布局
- 图8. 32位Java runtime 中Hashtable的内存使用量与布局
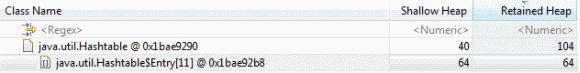
- 图8 展示了当Hashtable被创建时,其结果包括使用了40 bytes内的Hashtable对象与默认容量为11的Hashtable$entry数组,一个空的Hashtable的大小为104 bytes。
- 图8. 32位Java runtime 中Hashtable的内存使用量与布局
- Hashtable$Entry实际上存储着与HashMap相同的数据:
- int KeyHash
- Object next
- Object key
- Object value
- 这意味着Hashtable中为键/值 entry准备的Hashtable$Entry对象也是32 bytes ,并且含10K entry的Hashtable的开销和大小的估算(360K)和HashMap相近。
- 表4 展示了一个Hashtable的属性:
- 表4. Hashtable的属性
- 如你所见,Hashtable拥有略小于HashMap的默认容量(11 vs 16)。另外,Hashtable不能接收为null的key和value,并且它是默认同步的(或许不是必要的,并且会缩减容器性能)。Attribute Description Default capacity 11 entries Empty size 104 bytes Overhead 56 bytes plus 36 bytes per entry Overhead for a 10K collection ~360K Search/insert/delete performance O(1) — Time taken is constant time, regardless of the number of elements (assuming no hash collisions)
Java容器: LinkedList
-
LinkedList是List接口的链表实现。Java SE 6 API文档关于LinkedList的描述如下:
An ordered collection (also known as a sequence). The user of this interface has precise control over where in the list each element is inserted. The user can access elements by their integer index (position in the list), and search for elements in the list. Unlike sets, lists typically allow duplicate elements.
-
LinkedList由一群按链表连接的LinkedList$Entry对象实现。图9 展示了32位Java runtime 中LinkedList的内存使用量与布局:
- 图 9. 32位Java runtime 中LinkedList的内存使用量与布局
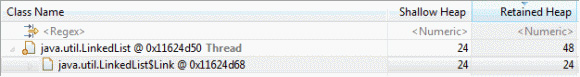
- 图9 展示了当LinkedList被创建时,其结果是一个LinkedList对像,以及24 bytes的单个LinkedList$Entry对象,一个空的LinkedList总共占48 bytes内存。
- 图 9. 32位Java runtime 中LinkedList的内存使用量与布局
-
链表的一个优势就是它的大小是精确的,并且不需要重置大小。默认的容量实际是一个entry,它的变大与收缩会随着更多entry的增加与删除而动态改变。每一个LinkedList$Entry对象仍会有开销,其字段组成如下:
- Object previous
- Object next
- Object value
-
不过它比HashMap和Hashtable的开销更小,因为链表只存储单个entry,而不是一个键/值对,并且不需要存储hash值(因为不需要基于数组查找)。在缺点方面,查询一个链表会非常慢,因为链表必须按顺序一个一个找到正确的entry。对于一个大的链表来说,获得结果会花费大量的查询时间。
-
表 5 展示了LinkedList的属性:
- 表 5. LinkedList的属性
Attribute Description Default capacity 1 entry Empty size 48 bytes Overhead 24 bytes, plus 24 bytes per entry Overhead for a 10K collection ~240K Search/insert/delete performance O(n) — Time taken is linearly dependent on the number of elements
Java容器: ArrayList
-
ArrayList是List接口对于可重置数组大小的实现。Java SE 6 API文档关于ArrayList的描述如下:
An ordered collection (also known as a sequence). The user of this interface has precise control over where in the list each element is inserted. The user can access elements by their integer index (position in the list), and search for elements in the list. Unlike sets, lists typically allow duplicate elements.
-
不像LinkedList,ArrayList是由Object数组实现的。图 10 展示了32位Java runtime 中ArrayList的内存使用量与布局:
- 图 10. 32位Java runtime 中ArrayList的内存使用量与布局
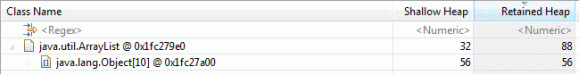
- 图 10 展示了当ArrayList被创建时,结果是32 bytes的ArrayList对象,以及默认大小为10的Object数组,一个空的ArrayList总的大小为88 bytes。这意味着ArrayList没有精确的大小,拥有默认大小为10个entry的容量。
- 图 10. 32位Java runtime 中ArrayList的内存使用量与布局
-
表 6 展示了ArrayList的属性:
- 表 6. ArrayList的属性:
Attribute Description Default capacity 10 Empty size 88 bytes Overhead 48 bytes plus 4 bytes per entry Overhead for 10K collection ~40K Search/insert/delete performance O(n) — Time taken is linearly dependent to the number of elements
其他容器类型
-
除了标准容器之外,StringBuffer也可以考虑作为容器,因为它管理了character数据,同时它在结构与功能上和其他容器相似。Java SE 6 API文档关于StringBuffer的描述如下:
A thread-safe, mutable sequence of characters… Every string buffer has a capacity. As long as the length of the character sequence contained in the string buffer does not exceed the capacity, it is not necessary to allocate a new internal buffer array. If the internal buffer overflows, it is automatically made larger.
-
StringBuffer的实现是char的数组。图 11 展示了32位Java runtime 中StringBuffer的内存使用量与布局:
- 图 11. 32位Java runtime 中StringBuffer的内存使用量与布局
- 图 11 展示了当StringBuffer被创建时,其结果包括了一个24 bytes的StringBuffer对,以及默认大小为16的character数组,一个空的StringBuffer总的大小为72 bytes。
- 图 11. 32位Java runtime 中StringBuffer的内存使用量与布局
-
如同容器,StringBuffe拥有默认的容量和能重置大小的构造。表 7 展示了StringBuffer的属性:
- 表 7. StringBuffer的属性
Attribute Description Default capacity 16 Empty size 72 bytes Overhead 24 bytes Overhead for 10K collection 24 bytes Search/Insert/Delete performance NA
容器中的空白空间(Empty space in collections)
- 容纳了某个数量的对象的各种容器的开销并不是完整的内存开销。在之前示例的度量中,假定了容器拥有精准的大小。但是对于大多数容器而言,这不太可能是真的。大多数容器被创建时,会有一个初始容量,然后数据才被放入容器中。这意味着容器的容量大于被放入的数据的数量是普遍的情况,这将会导致额外的开销。
- 思考一下StringBuffer的示例。它的默认容量是16个character,一共72 bytes。初始化时,没有数据被存入这72 bytes中。如果你放一些character到character数组中,例如“MY STRING”,这会将9个character存入长度为16的character数组中。图 12 展示了32位Java runtime 中包含“MY STRING”的StringBuffer的内存使用情况:
- 图 12. 32位Java runtime 中包含“MY STRING”的StringBuffer的内存使用情况
- 如图 12 所示,在数组中有7个额外的character没有被使用,但却消耗了内存(此处额外花费了112 bytes)。此容器中,16的容量使用了的有9个entry,填充比为0.56。填充比越低,空闲的容量导致的开销就越多。
- 图 12. 32位Java runtime 中包含“MY STRING”的StringBuffer的内存使用情况
容器的扩容与大小重置
- 当容器的数据量达到其容量,并再发送一个添加额外entries的请求,这时容器需要重置大小并扩容以至于能够容纳新的entries。这会增加容量,但是通常会导致低充填比和额外的内存开销。
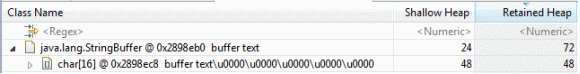
- 容器的扩容算法各不相同,但通常会接近容器容量的2倍。这正是StringBuffer中所采取的方法。在之前的StringBuffer的示例中,如果你想追加“OF TEXT”到缓冲中生成“MY STRING OF TEXT”,你需要扩充容器,因为新的character容器需要17个entry,而不是现在16的容量。图 13 展示了内存的使用情况:
- 图 13. 32位Java runtime中包含“MY STRING OF TEXT”的StringBuffer的内存使用情况

- 现在,如图 13 所示,你拥有32个character的entry,其中有17个被使用,此时填充比是0.53。填充比并没有显著的下降,但是你现在有240 bytes的额外开销用于空闲容量。
- 图 13. 32位Java runtime中包含“MY STRING OF TEXT”的StringBuffer的内存使用情况
- 此处是较小的字符串和容器,它的低充填比、空闲容量导致的开销似乎看不出来问题,但是当大小变大时,开销将会变得明显且昂贵。例如,如果你创建一个含有16MB数据量的StringBuffer,默认情况下会使用能够装下32MB数据量的character数组(会创建16MB的额外开销用于空闲容量)。
Java容器:总览
- 表8 总览容器的属性:
- 表8. 容器属性的总览
Collection Performance Default capacity Empty size 10K entry overhead Accurately sized? Expansion algorithm HashSetO(1) 16 144 360K No x2 HashMapO(1) 16 128 360K No x2 HashtableO(1) 11 104 360K No x2+1 LinkedListO(n) 1 48 240K Yes +1 ArrayListO(n) 10 88 40K No x1.5 StringBufferO(1) 16 72 24 No x2 - Hash容器的性能高于所有的List,但每个entry会有更多的花费。为了获得访问性能,如果你创建一个容器(例如用来实现缓存),更好的方式是不顾额外的开销创建基于Hash的容器。
- 对于访问性能不太成问题的较小集合,List是一个选择。ArrayList 和 LinkedList 的性能约为相同,但是它们的内存占用不同:ArrayList 每一个entry的大小小于LinkedList,但不是精确的大小。List的实现中,ArrayList 与 LinkedList 哪一个是正确的选择取决于List的长度是否可预测。如果长度未知,LinkedList或许是正确的选择,因为容器需要较少的空白的空间。如果大小已知,ArrayList拥有更少的内存开销。
- 选择使用正确的容器类型需要在容器性能与内存占用之间取得恰当的平衡点。另外,你可以通过正确的设置容器达到最大充填比与最小未使用空间,从而使内存占用降到最低。
在PlantsByWebSphere 与 WebSphere Application Server Version 7中容器的使用
-
In Table 8, the overhead of creating a 10,000-entry Hash-based collection is shown to be 360K. Given that it’s not uncommon for complex Java applications to run with Java heaps sized in gigabytes, this does not seem like a large overhead — unless, of course, a large number of collections are being used.
-
Table 9 shows the collection-object usage as part of the 206MB of Java heap usage when the PlantsByWebSphere sample application supplied with WebSphere® Application Server Version 7 runs under a five-user load test:
- 表 9. 在PlantsByWebSphere 与 WebSphere Application Server Version 7中容器的使用
-
You can see from Table 9 that more than 300,000 different collections are being used — and that the collections themselves, not counting the data they contain, account for 42.9MB (21 percent) of the 206MB Java heap usage. This means that substantial potential memory savings are available if you either change collection types or ensure that the sizes of the collections are more accurate.
使用Memory Analyzer分析低填充比
- The IBM Monitoring and Diagnostic Tools for Java - Memory Analyzer tool (Memory Analyzer) that is available as part of the IBM Support Assistant can analyze Java collections’ memory usage (see Related topics). Its capabilities include analysis of fill ratios and the sizes of collections. You can use this analysis to identify any collections that are candidates for optimization.
- The collection-analysis capabilities in Memory Analyzer are located under the Open Query Browser -> Java Collections menu, as shown in Figure 14:

- The Collection Fill Ratio query selected in Figure 14 is the most useful for identifying collections that are much larger than currently required. You can specify a number of options for this query, including:
- objects : The types of objects (collections) you are interested in
- segments : The fill ratio ranges to group the objects into
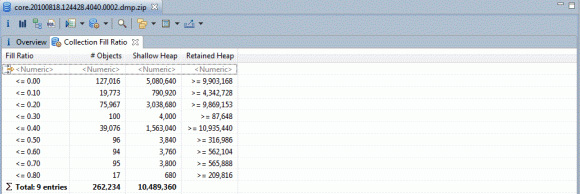
- Running the query with the objects options set to “java.util.Hashtable” and the segments option set to “10” produces the output shown in Figure 15:
- Figure 15. Analysis in Memory Analyzer of the fill ratio of Hashtables
- Figure 14. Analysis of the fill ratio of Java collections in Memory Analyzer
- Figure 15. Analysis in Memory Analyzer of the fill ratio of Hashtables
- It’s then possible to identify these collections by selecting a row of the results table and right-clicking to select either list objects -> with incoming references to see what objects own those collections or list objects -> with outgoing references to see what is inside those collections. Figure 16 shows the results of looking at the incoming references for the empty Hashtables and expanding a couple of the entries:
- Figure 16. Analysis of the incoming references to empty Hashtables in Memory Analyzer
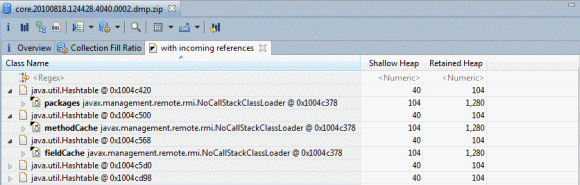
- Figure 16 shows that some of the empty Hashtables are owned by the javax.management.remote.rmi.NoCallStackClassLoader code.
- Figure 16. Analysis of the incoming references to empty Hashtables in Memory Analyzer
- By looking at the Attributes view in the left-hand panel of Memory Analyzer, you can see specific details about the Hashtable itself, as shown in Figure 17:
- Figure 17. Inspection of the empty Hashtable in Memory Analyzer
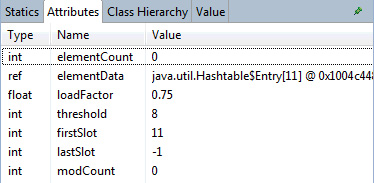
- Figure 17 shows that the Hashtable has a size of 11 (the default size) and that it is completely empty.
- Figure 17. Inspection of the empty Hashtable in Memory Analyzer
- For the javax.management.remote.rmi.NoCallStackClassLoader code, it might be possible to optimize the collection usage by:
- Lazily allocating the Hashtable: If it is common for the Hashtable to be empty, then it may make sense for the Hashtable to be allocated only when there is data to store inside it.
- Allocating the Hashtable to an accurate size: Because the default size has been used, it’s possible that a more accurate initial size could be used.
Whether either or both of these optimizations are applicable depends on how the code is commonly used, and what data is commonly stored inside it.
PlantsByWebSphere中的空白容器示例
-
Table 10 shows the result of analyzing collections in the PlantsByWebSphere example to identifying those that are empty:
- 表10 PlantsByWebSphere中的空白容器示例
Collection type Number of instances Empty instances % Empty Hashtable262,234 127,016 48.4 WeakHashMap19,562 19,465 99.5 HashMap10,600 7,599 71.7 ArrayList9,530 4,588 48.1 HashSet1,551 866 55.8 Vector1,271 622 48.9 Total 304,748 160,156 52.6 - Table 10 shows that on average, over 50 percent of the collections are empty, implying that significant memory-footprint savings could be gained by optimization of collection usage. It could be applied to various levels of the application: in the PlantsByWebSphere example code, in the WebSphere Application Server, and in the Java collections classes themselves.
-
Between WebSphere Application Server version 7 and version 8, some work has been done to improve memory efficiency in the Java collections and middleware layers. For example, a large percentage of the overhead of instances of java.util.WeahHashMap is due to the fact that it contains an instance of java.lang.ref.ReferenceQueue to handle the weak references. Figure 18 shows the memory layout of a WeakHashMap for a 32-bit Java runtime:
- Figure 18. Memory layout of a WeakHashMap for a 32-bit Java runtime
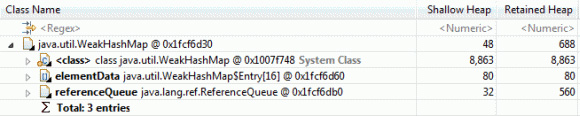
- Figure 18 shows that the ReferenceQueue object is responsible for retaining 560 bytes’ worth of data, even if the WeakHashMap is empty and ReferenceQueue is therefore not required. For the PlantsByWebSphere example case with 19,465 empty WeakHashMaps, the ReferenceQueue objects are adding an additional 10.9MB of data that is not required. In WebSphere Application Server version 8 and the Java 7 release of the IBM Java runtimes, the WeakHashMap has undergone some optimization: It contains a ReferenceQueue, which in turn contains an array of Reference objects. That array has been changed to be allocated lazily — that is, only when objects are added to the ReferenceQueue.
- Figure 18. Memory layout of a WeakHashMap for a 32-bit Java runtime
结束语
- 在任何给定的应用程序中都会存在大量且可能令人惊讶的数量的集合,对于复杂的应用程序更是如此。使用大量的集合时,通常需要某些能显著节省内存占用的手段,可以通过选择正确的集合、正确的大小以及惰性分配来解决。这些决策最好是在设计和开发过程中做出,但是你也可以使用Memory Analyzer工具来分析现有的应用程序,以实现潜在的内存占用优化。
