一个网页的加载速度,跟父请求和子请求都是有关系的。
(1)、子请求出现了如404或者500之类的错误,会严重影响整个网页的加载速度。
(2)、子请求的响应速度慢,也会影响网页的加载速度。
我们在fiddler中的statistics面板选项,可以清楚的看到每个http请求的响应时间。
在overall elapsed中能看到http响应返回需要的响应时间。
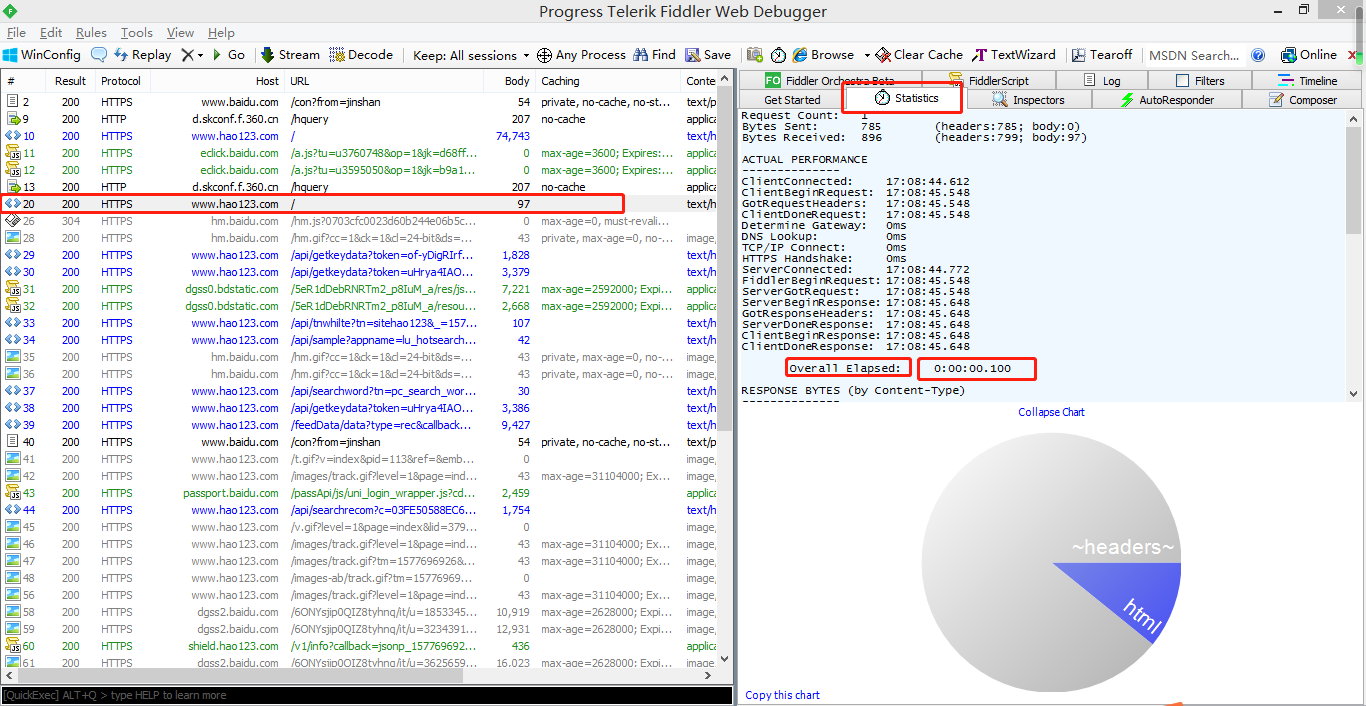
Request Count:   1
Bytes Sent:      785        (headers:785; body:0)
Bytes Received:  896        (headers:799; body:97)

ACTUAL PERFORMANCE
--------------
ClientConnected:    17:08:44.612
ClientBeginRequest:    17:08:45.548
GotRequestHeaders:    17:08:45.548
ClientDoneRequest:    17:08:45.548
Determine Gateway:    0ms
DNS Lookup:         0ms
TCP/IP Connect:    0ms
HTTPS Handshake:    0ms
ServerConnected:    17:08:44.772
FiddlerBeginRequest:    17:08:45.548
ServerGotRequest:    17:08:45.548
ServerBeginResponse:    17:08:45.648
GotResponseHeaders:    17:08:45.648
ServerDoneResponse:    17:08:45.648
ClientBeginResponse:    17:08:45.648
ClientDoneResponse:    17:08:45.648

    Overall Elapsed:    0:00:00.100

RESPONSE BYTES (by Content-Type)
--------------
~headers~: 799
text/html: 97


ESTIMATED WORLDWIDE PERFORMANCE
--------------
The following are VERY rough estimates of download times when hitting servers based in Seattle.

US West Coast (Modem - 6KB/sec)
    RTT:        0.10s
    Elapsed:    0.10s

Japan / Northern Europe (Modem)
    RTT:        0.15s
    Elapsed:    0.15s

China (Modem)
    RTT:        0.45s
    Elapsed:    0.45s

US West Coast (DSL - 30KB/sec)
    RTT:        0.10s
    Elapsed:    0.10s

Japan / Northern Europe (DSL)
    RTT:        0.15s
    Elapsed:    0.15s

China (DSL)
    RTT:        0.45s
    Elapsed:    0.45s


________________
Learn more about HTTP performance at http://fiddler2.com/r/?HTTPPERF
statistics面板选项:是一个详情和数据统计面板,显示了每条http请求的具体统计信息,如:发送、接收的字节数,发送、接收时间,
以及粗略的统计世界各地访问该服务器所花费的时间。