本教程为脑机学习者Rose发表于公众号:脑机接口社区(微信号:Brain_Computer).QQ交流群:903290195

Epoch概念简介
相信很多人第一次接触epoch时,都会有疑惑,这个词在EEG中到底指的是什么。
下面将详细说明一下。
从连续的脑电图信号中提取一些特定时间窗口的信号,这些时间窗口可以称作为epochs.
由于EEG是连续收集的,要分析脑电事件相关的电位时,需要将信号"切分"成时间片段,这些时间片段被锁定到某个事件(例如刺激)中的时间片段。
比如在EEGLAB分析中,EEGLAB将连续数据视为由一个较长的时期(long epoch)组成,而将数据切分后,它由多个较小的时期(small epoch)组成。
举个例子
假设我们有一个长度为60s的信号x,采样频率为1 Hz.
脑电信号的矩阵表示为1x60矩阵,如果将信号划分成一些2s的信号,则将有30个peoch(信号中每2s就是一个epoch)
在MNE中,Epoch对象是一种把连续型数据作为时间段集合的表示方法,
形状为(n_events,n_channels,n_times)的数组形式:
创建Epochs对象方式有三种:
(1)通过Raw对象和事件事件点(event times)
(2)通过读取.fif文件数据生成Epoch对象
(3)通过mne.EpochsArray从头创建Epoch对象
这里利用方式2和方式3创建Epochs对象
a. 读取fif文件创建Epoch对象
步骤:
1)读取fif文件,构建raw对象;
2)创建event对象;
3)创建epoch对象;
4)对epoch进行叠加平均得到evoked对象;
5)绘制evoked。
import mne
from mne import io
from mne.datasets import sample
data_path = sample.data_path()
raw_fname = data_path + '/MEG/sample/sample_audvis_filt-0-40_raw.fif'
event_fname = data_path + '/MEG/sample/sample_audvis_filt-0-40_raw-eve.fif'
event_id, tmin, tmax = 1, -0.2, 0.5
# 读取fif文件,创建raw对象
raw = io.read_raw_fif(raw_fname)
# 读取包含event的fif文件,创建event对象
events = mne.read_events(event_fname)
"""
挑选通道:EEG + MEG - bad channels
"""
raw.info['bads'] += ['MEG 2443', 'EEG 053'] # bads + 2 more
picks = mne.pick_types(raw.info, meg=True, eeg=False, stim=True, eog=True,
exclude='bads')
# 读取Epoch数据
epochs = mne.Epochs(raw, events, event_id, tmin, tmax, proj=True,
picks=picks, baseline=(None, 0), preload=True,
reject=dict(grad=4000e-13, mag=4e-12, eog=150e-6))
"""
对epochs数据进行求平均获取诱发响应
"""
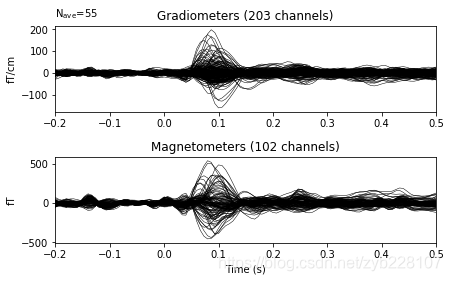
evoked = epochs.average()
evoked.plot(time_unit='s')
plt.show()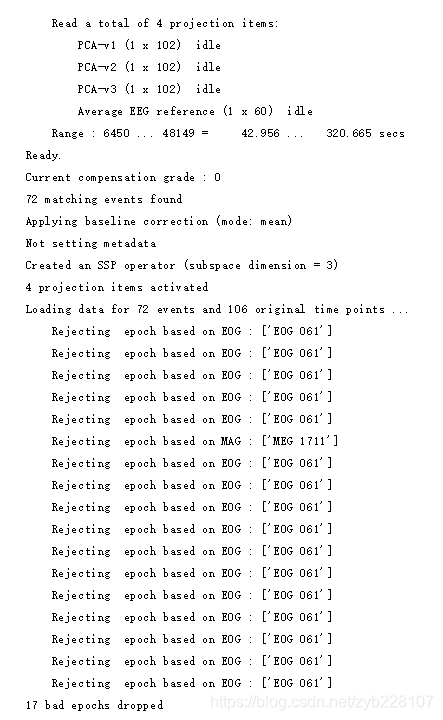
b. 从头创建Epoch对象
在实际过程中,有时需要从头构建数据来创建Epochs对象,
方式:利用mne.EpochsArray创建Epochs对象,创建时直接构建numpy数组即可,数组的形状必须是(n_epochs, n_chans, n_times)
数据对应的单位:
V: eeg, eog, seeg, emg, ecg, bio, ecog
T: mag
T/m: grad
M: hbo, hbr
Am: dipole
AU: misc
案例1
import mne
import numpy as np
import matplotlib.pyplot as plt
第一步:构建数据
构建一个大小为10x5x200的三维数组,数组中数据是随机数;
第一维数据表示:10 epochs
第二维数据表示:5 channels
第三维数据表示:2 seconds per epoch
# 采样频率
sfreq = 100
data = np.random.randn(10, 5, sfreq * 2)

# 创建一个info结构
info = mne.create_info(
    ch_names=['MEG1', 'MEG2', 'EEG1', 'EEG2', 'EOG'],
    ch_types=['grad', 'grad', 'eeg', 'eeg', 'eog'],
    sfreq=sfreq
)
第二步:构建events
在创建Epochs对象时,必须提供一个"events"数组,
事件(event)描述的是某一种波形(症状)的起始点,其为一个三元组,形状为(n_events,3):
第一列元素以整数来描述的事件起始采样点;
第二列元素对应的是当前事件来源的刺激通道(stimulus channel)的先前值(previous value),该值大多数情况是0;
第三列元素表示的是该event的id。
events = np.array([
    [0, 0, 1],
    [1, 0, 2],
    [2, 0, 1],
    [3, 0, 2],
    [4, 0, 1],
    [5, 0, 2],
    [6, 0, 1],
    [7, 0, 2],
    [8, 0, 1],
    [9, 0, 2],
])
设置事件的id
如果是dict,则以后可以使用这些键访问关联的事件。示例:dict(听觉=1,视觉=3)
如果是int,将创建一个id为string的dict。
如果是列表,则使用列表中指定ID的所有事件。
如果没有,则所有事件都将与一起使用,并使用与事件id整数对应的字符串整数名称创建dict。
# 创建event id,受试者或者微笑或者皱眉
event_id = dict(smiling=1, frowning=2)
"""
tmin:event开始前的时间,如果未指定,则默认为0
"""
# 设置事件开始前时间为-0.1s
tmin = -0.1
第三步:创建epochs对象
"""
利用mne.EpochsArray创建epochs对象
"""
custom_epochs = mne.EpochsArray(data, info, events, tmin, event_id)
print(custom_epochs)
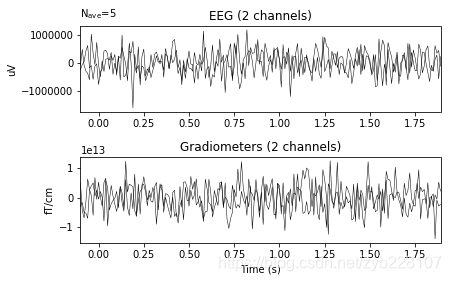
# 绘制
_ = custom_epochs['smiling'].average().plot(time_unit='s')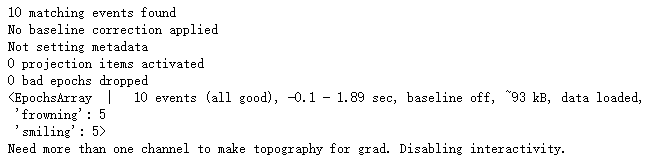
案例2
import numpy as np
import neo

import mne
import matplotlib.pyplot as plt

"""
设置event id,用来识别events.
"""
event_id = 1
# 第一列表示样本编号
events = np.array([[200, 0, event_id],
                   [1200, 0, event_id],
                   [2000, 0, event_id]])  # List of three arbitrary events

sfreq = 1000  # 采样频率
times = np.arange(0, 10, 0.001)  # Use 10000 samples (10s)

sin = np.sin(times * 10)  # 乘以 10 缩短周期
cos = np.cos(times * 10)

"""
利用sin和cos创建一个2个通道的700 ms epochs的数据集

只要是(n_epochs, n_channels, n_times)形状的数据,都可以被用来创建
"""
epochs_data = np.array([[sin[:700], cos[:700]],
                        [sin[1000:1700], cos[1000:1700]],
                        [sin[1800:2500], cos[1800:2500]]])

ch_names = ['sin', 'cos']
ch_types = ['mag', 'mag']
info = mne.create_info(ch_names=ch_names, sfreq=sfreq, ch_types=ch_types)

epochs = mne.EpochsArray(epochs_data, info=info, events=events,
                         event_id={'arbitrary': 1})

epochs.plot(scalings='auto' )
plt.show()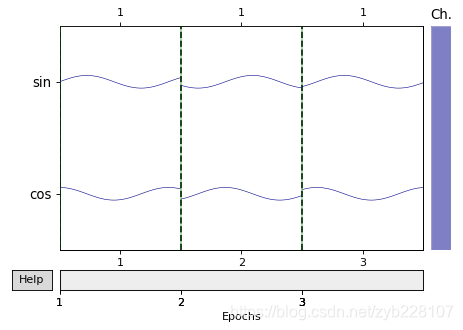
本文章由脑机学习者Rose笔记分享,QQ交流群:903290195
更多分享,请关注公众号