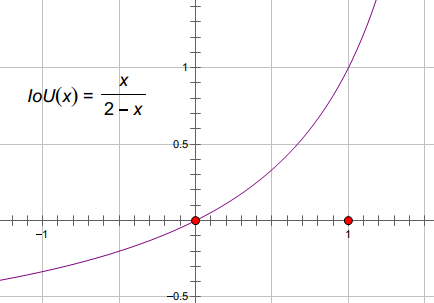
Dice Similarity Coefficent vs. IoU
Several readers emailed regarding the segmentation performance of the FCN-8s model I trained in Chapter Four. Specifically, they asked for more detail regarding quantification metrics used to measure the segmentation performance of deep neural networks (DNN). Recall that the Dice similarity coefficient (a.k.a Dice score) was used to to quantify how closely FCN-8s matched the training dataset’s hand annotated ground truth segmentation. The FCN-8s model using the Adam adaptive optimizer had a Dice score of over 96% when trained on preprocessed CT images. But what exactly does this score measure? In this article we’ll learn more about the Dice coefficient and contrast it to the intersection over union (IoU) score which is another popular measure of an algorithm’s pixel-level image segmentation performance.
Take a look at the Cityscapes Dataset segmentation leaderboard in Figure 1. The segmented features of interest in this image dataset are common objects found in a typical city scene such as buildings, roads and traffic lights. Clearly the Cityscapes Dataset is useful for training autonomous driving deep learning networks! Competing DNN models are listed in column 1. Column 2 lists the mean IoU score for each DNN which is the simple average of the per class IoU score. The per class IoU scores for the first 7 classes (road, sidewalk, building etc.) are displayed in columns 3 through 9. To further confuse you, IoU is also known as the Jaccard similarity coefficient or Jaccard score.
IoU and Dice use slightly different approaches to measure how similar an image segmentation algorithm’s results are to it’s corresponding ground truth segmentation. Let’s take a look at IoU first as it is easy to represent geometrically:
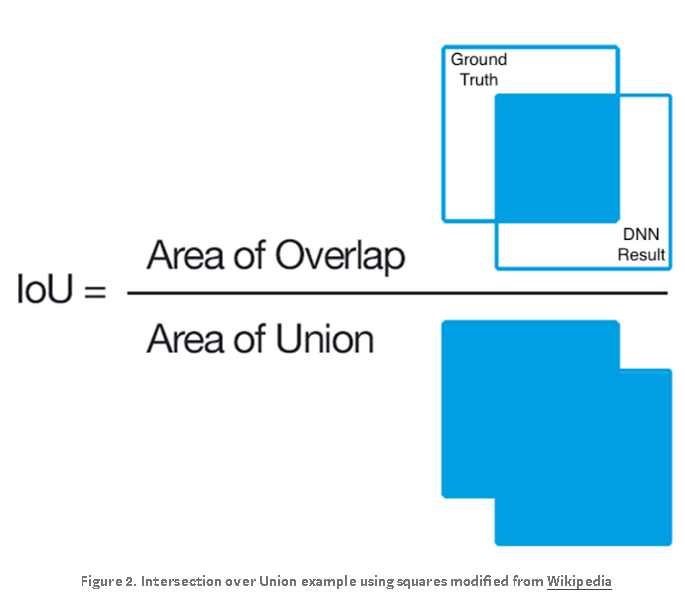
In Figure 2, assume the box in the upper left labeled “Ground Truth” is the segmentation region annotated by humans. The box labeled “DNN Result” is the segmentation result produced a deep learning algorithm on the same image. The area of overlap between human and AI results is the blue square in the numerator image. This is the region where an image segmentation algorithm identifies pixels that exactly match the annotated ground truth segmentation. These pixels are known as true positives (TP). The area of union in the denominator combines the segmentation results of both human and AI and then subtracts the true positives to prevent those pixels from being double counted:
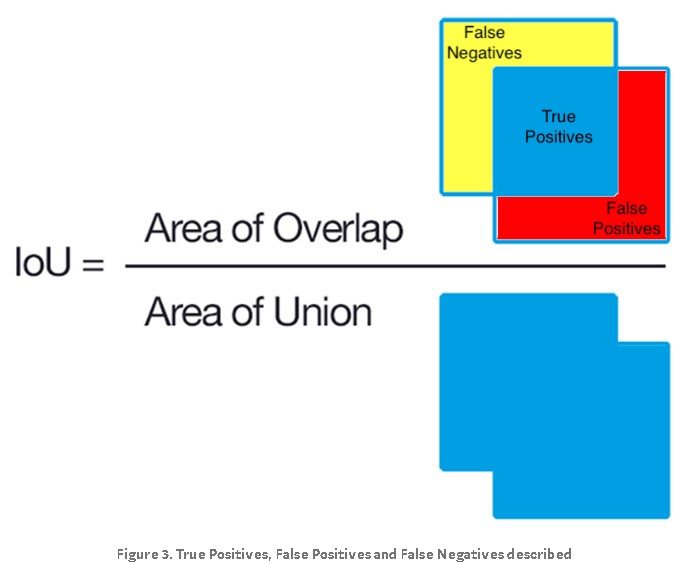
In Figure 3, the pixels in the red region were erroneously segmented by the DNN and are known as false positives (FP). The pixels in the yellow region should have segmented by the DNN but were missed. These missed pixels are known as false negatives (FN). If the area of overlap equals the area of union, we have perfect segmentation and the IoU is equal to 1. In that case, FP, TP and FN are all equal to 0:
How does IoU score relate to the Dice’s similarity coefficient? Let’s rewrite IoU terms of TP, FP and FN regions shown in Figure 3:

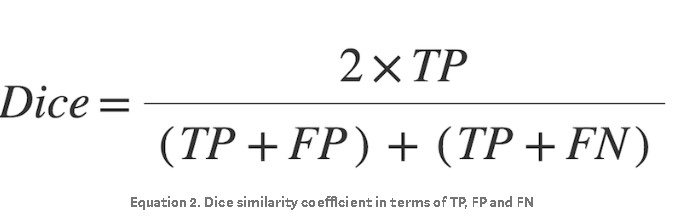
The derivation of the Dice score is not as easily described geometrically as IoU and is beyond the scope of this article. The interested reader is encouraged to look here under the subheading F-measure. The Dice score can be expressed in terms of TP, FP and FN as follows:
A little algebra yields the following equivalence relations:
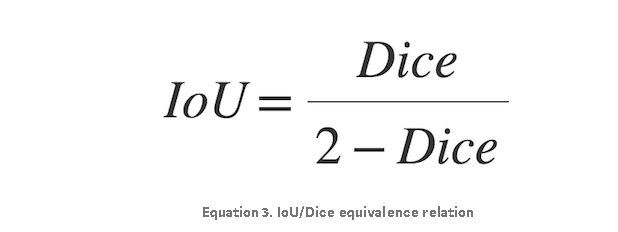
Revisiting Chapter 4, the FCN-8s DNN using the Adam optimizer on my preprocessed CT training image dataset had a Dice value of 0.961951 (~96%). Plugging this value into the Equation 3, we get a corresponding IoU score of 0.926691 (~93%). Regardless of metric chosen, considering the best mean IoU value in the Cityscapes Dataset is 83.2%, this is one high-performing fully convolutional neural net!