自定义绘图
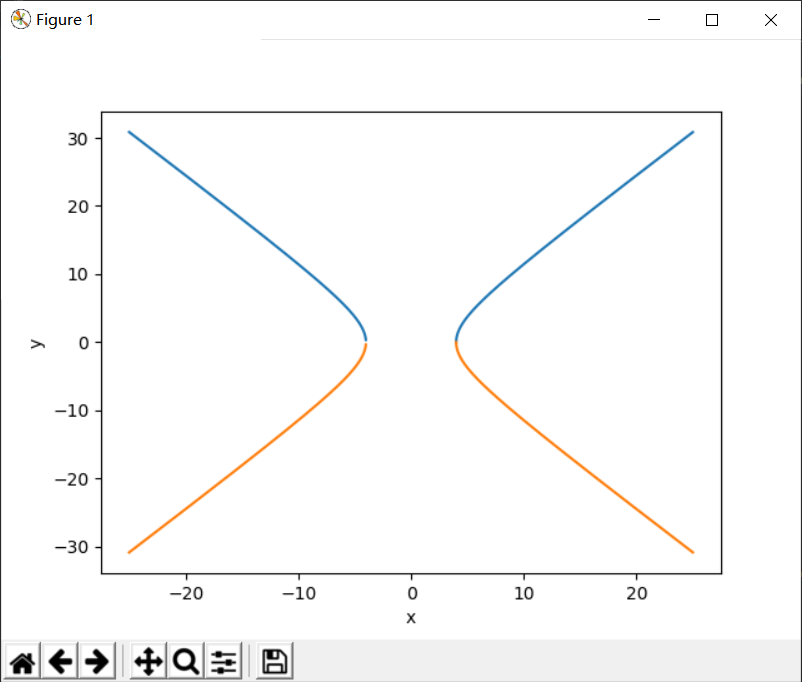
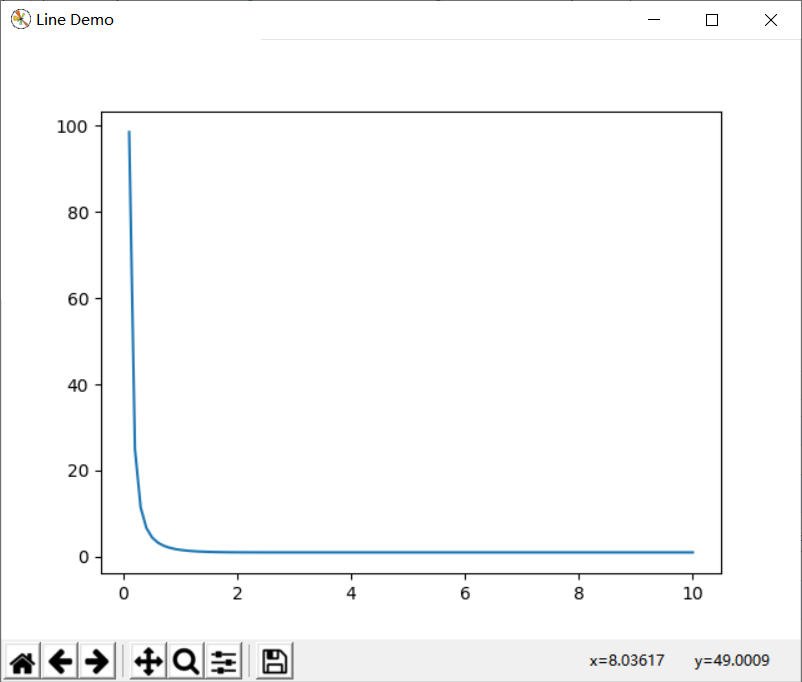
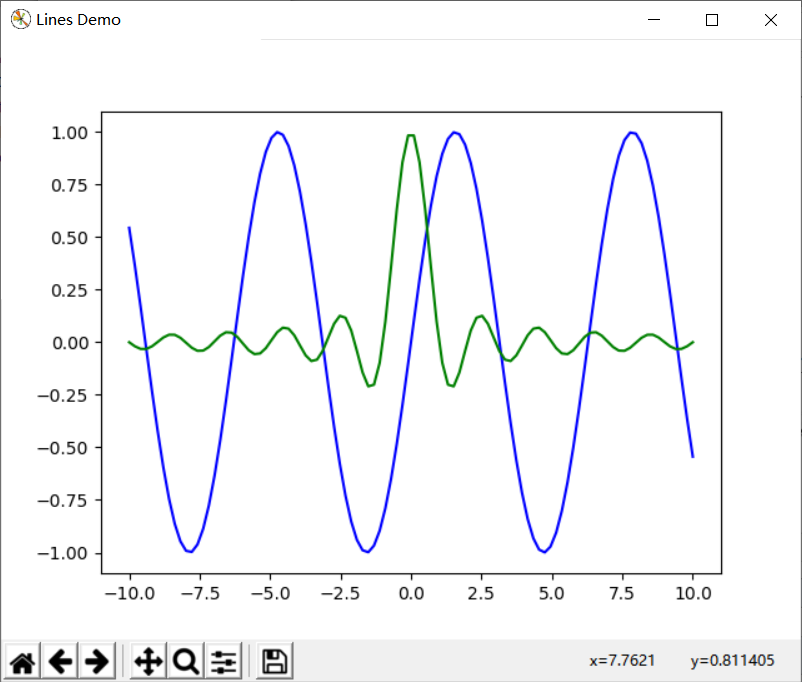
 1 # -*-coding:utf-8-*-
 2 # !/usr/bin/env python
 3 # Author:@vilicute
 4
 5 import numpy as np
 6 import matplotlib.pyplot as plt
 7
 8 def draw_line():
 9     '''
10     绘制曲线
11     '''
12     figure = plt.figure('Line Demo')
13     x = np.linspace(0, 10, 100) # (起始值,终值,间隔数)
14     y = 1/(1 - np.exp(-x**2))
15     plt.plot(x, y)
16     plt.show()
17
18 def draw_lines():
19     figure = plt.figure('Lines Demo')
20     x = np.linspace(-10, 10, 100)
21     y1 = 1
22     y2 = np.sin(x)
23     y3 = np.sinc(x)
24     plt.plot(x, y2, 'b-', x, y3, 'g-')
25     plt.show()
26
27 def draw_pie():
28     '''
29     绘制饼图
30     '''
31     figure = plt.figure('Pie Demo')
32     labels = 'A', ' B', 'C', 'D'    #各部分的名称
33     sizes = [40, 25, 20, 15]        #所占的百分比
34     explode = [0.01, 0, 0.02, 0]    #块的间隔
35     plt.pie(sizes, labels=labels, explode=explode, autopct='%1.1f%%', startangle=90)
36     plt.axis('equal')
37     plt.show()
38
39 def draw_hist():
40     '''
41     绘制直方图
42         numpy.random.seed()可以使多次生成的随机数相同。如果在seed()中传入的数字相同,那么接下来使用
43     random()或者rand()方法所生成的随机数序列都是相同的(仅限使用一次random()或者rand()方法,第二次以
44     及更多次仍然是随机的数字),知道改变传入seed()的值,以后再改回来,random()生成的随机数序列仍然与之
45     前所产生的序列相同。
46     '''
47     np.random.seed(20190308);
48     figure = plt.figure('Pie Demo');
49     plt.hist(np.random.rand(30), 20, histtype='bar', facecolor='g', alpha=0.75, rwidth=0.95);
50     plt.show();
51
52 def draw_bar():
53     '''
54     绘制条形图
55     '''
56     figure = plt.figure('Pie Demo')
57     labels = 'A', 'B', 'C', 'D'
58     sizes = [12, 23, 5, 31]
59     plt.bar(labels, sizes, width=0.5)
60     plt.show()
61
62
63 def draw_function():
64     x = np.arange(-25, 25, 0.01)
65     y1 = 1.25 * np.sqrt(x ** 2 - 16)
66     y2 = -1.25 * np.sqrt(x ** 2 - 16)
67     plt.xlabel('x')
68     plt.ylabel('y')
69     plt.plot(x, y1)
70     plt.plot(x, y2)
71
72     plt.show()
73
74 draw_function()
75 draw_line()
76 draw_lines()
77 draw_pie()
78 draw_hist()
79 draw_bar()
draw_function(),draw_line(),draw_lines()
draw_pie(),draw_hist() ,draw_bar()


