import numpy as np
from keras.datasets import mnist
from keras.utils import np_utils
from keras.models import Sequential
from keras.layers import Dense,Dropout,Convolution2D,MaxPooling2D,Flatten
from keras.optimizers import Adam
from keras.utils.vis_utils import plot_model
import matplotlib.pyplot as plt
# install pydot and graphviz
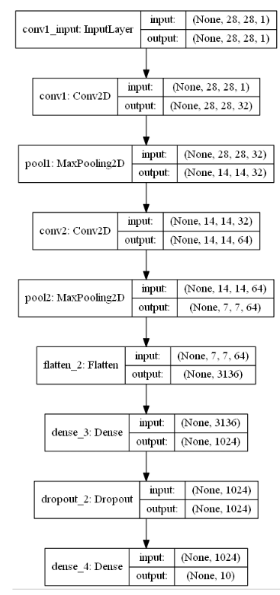
 1 # 载入数据
 2 (x_train,y_train),(x_test,y_test) = mnist.load_data()
 3 # (60000,28,28)->(60000,28,28,1)
 4 x_train = x_train.reshape(-1,28,28,1)/255.0
 5 x_test = x_test.reshape(-1,28,28,1)/255.0
 6 # 换one hot格式
 7 y_train = np_utils.to_categorical(y_train,num_classes=10)
 8 y_test = np_utils.to_categorical(y_test,num_classes=10)
 9
10 # 定义顺序模型
11 model = Sequential()
12
13 # 第一个卷积层
14 # input_shape 输入平面
15 # filters 卷积核/滤波器个数
16 # kernel_size 卷积窗口大小
17 # strides 步长
18 # padding padding方式 same/valid
19 # activation 激活函数
20 model.add(Convolution2D(
21     input_shape = (28,28,1),
22     filters = 32,
23     kernel_size = 5,
24     strides = 1,
25     padding = 'same',
26     activation = 'relu',
27     name = 'conv1'
28 ))
29 # 第一个池化层
30 model.add(MaxPooling2D(
31     pool_size = 2,
32     strides = 2,
33     padding = 'same',
34     name = 'pool1'
35 ))
36 # 第二个卷积层
37 model.add(Convolution2D(64,5,strides=1,padding='same',activation = 'relu',name='conv2'))
38 # 第二个池化层
39 model.add(MaxPooling2D(2,2,'same',name='pool2'))
40 # 把第二个池化层的输出扁平化为1维
41 model.add(Flatten())
42 # 第一个全连接层
43 model.add(Dense(1024,activation = 'relu'))
44 # Dropout
45 model.add(Dropout(0.5))
46 # 第二个全连接层
47 model.add(Dense(10,activation='softmax'))
48
49 # # 定义优化器
50 # adam = Adam(lr=1e-4)
51
52 # # 定义优化器,loss function,训练过程中计算准确率
53 # model.compile(optimizer=adam,loss='categorical_crossentropy',metrics=['accuracy'])
54
55 # # 训练模型
56 # model.fit(x_train,y_train,batch_size=64,epochs=1)
57
58 # # 评估模型
59 # loss,accuracy = model.evaluate(x_test,y_test)
60
61 # print('test loss',loss)
62 # print('test accuracy',accuracy)
plot_model(model,to_file="model.png",show_shapes=True,show_layer_names=True,rankdir='TB')
plt.figure(figsize=(10,10))
img = plt.imread("model.png")
plt.imshow(img)
plt.axis('off')
plt.show()