% 经纬度转换
load('lon_lat.mat')
mstruct = defaultm('mercator');
mstruct.geoid = [6378137, 0.0818191908426215];
mstruct.origin = [0,0,0];
[x,y] = projfwd(mstruct,lon_lat(:,2) ,lon_lat(:,1));
% 将配送站设置为中为原点
x = x - x(1);   x(1) = [];
y = y - y(1);   y(1) = [];

% 求每个客户点的方位角
cos_alpha = x./sqrt(x.^2+y.^2);
sin_alpha = y./sqrt(x.^2+y.^2);
cos_sin = [cos_alpha, sin_alpha];
# 观察在新的坐标系下的分布
在新的坐标系下,映射每个客户点的坐标
load('Data/information.mat','Request_info','Distance','Time')
Timewindow = Request_info(:,4:5);
Timewindow(1001:1100,:) = 960;
dis = Distance(:,1);  dis(1) = [];
dis_time = Time(:,1); dis_time(1) = [];
dis_time = repmat(dis_time,1,2);
trans_timewindow_dis = (Timewindow - dis_time);
trans_timewindow_dis(1001:1100,1) = 0;
startpoint = [trans_timewindow_dis(:,1).*cos_alpha, trans_timewindow_dis(:,1).*sin_alpha];
endpoint = [trans_timewindow_dis(:,2).*cos_alpha, trans_timewindow_dis(:,2).*sin_alpha];
绘图
X = [startpoint(:,1), endpoint(:,1)];
Y = [startpoint(:,2), endpoint(:,2)];
figure(1);clf
hold on
for i = 1:1000
    line(X(i,:),Y(i,:),'LineWidth',1.2)
end
% for i = 1001:1100
%     line(X(i,:),Y(i,:),'LineWidth',1.2,'Color','g')
% end
title('在新的坐标系下的每个客户点的服务时间')
hold off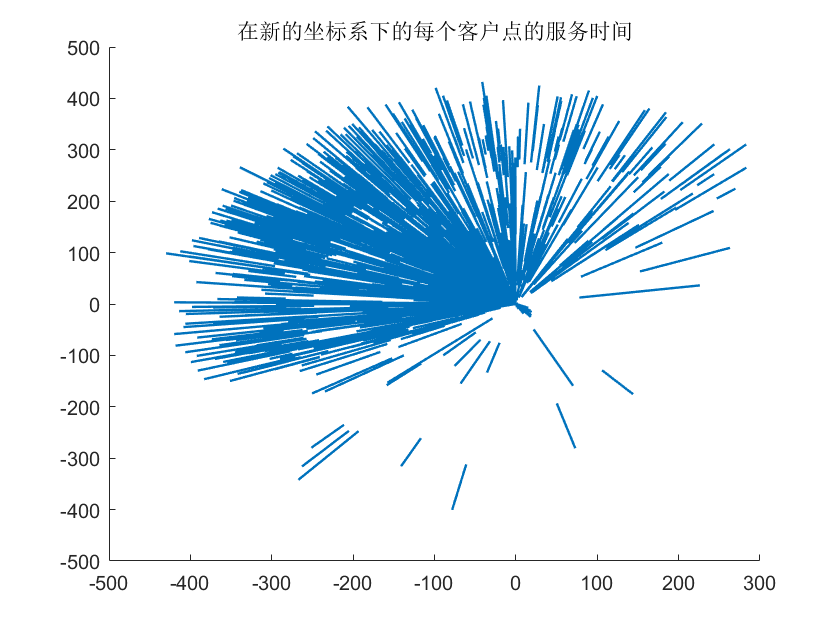
figure(2);clf
hold on
for i = 1:1000
    scatter((X(i,1)+X(i,2))/2,(Y(i,1)+Y(i,2))/2,10,'*')
end
scatter((X(1001:1100,1)+X(1001:1100,2))/2,(Y(1001:1100,1)+Y(1001:1100,2))/2,10,'g*')
title('在新的坐标系下的每个客户点的服务时间的中间点')
hold off
kmeans 聚类
使用kmeans 聚类对原始坐标和时间窗聚类
Timewindow(1001:1100,:) = repmat([0,960],100,1);
Var = [x,y,Timewindow];
idx = kmeans(Var(1:1000,:),10);
idx(1001:1100) = 0;
figure(3);hold on;
scatter(0, 0, 20,'rp')
scatter(x(idx==0), y(idx==0),15,'g','filled','MarkerFaceAlpha',0.3)
legendname{1} = '配送站';
legendname{2} = '充电站';
for i = 1:10
    scatter(x(idx==i), y(idx==i),10,'*','MarkerFaceAlpha',0.8)
    legendname{i+2} = ['label=',num2str(i)];
end
legend(legendname,'Location','northeastoutside','NumColumns',1)
title('直接对原始坐标和时间窗聚类')
hold off
对在新坐标系下的点,用kmeans聚类方法得到每个点的标签,然后映射回原始坐标系中
figure(4);clf
subplot(1,2,1);hold on
scatter(0, 0,20,'rp')
scatter(x(1001:1100), y(1001:1100),15,'g','filled','MarkerFaceAlpha',0.3)
scatter(x(1:1000), y(1:1000),10,'b*','MarkerFaceAlpha',0.8)
legend({'配送中心','充电站','需求点'})
title('贴上标签前')
hold off

subplot(1,2,2);hold on;
Xc = (X(:,1)+X(:,2))/2;
Yc = (Y(:,1)+Y(:,2))/2;
idx = kmeans([Xc(1:1000),Yc(1:1000)],10);
idx(1001:1100) = 0;
scatter(0, 0, 20,'rp')
scatter(x(idx==0), y(idx==0),15,'g','filled','MarkerFaceAlpha',0.3)
legendname{1} = '配送站';
legendname{2} = '充电站';
for i = 1:10
    scatter(x(idx==i), y(idx==i),10,'*','MarkerFaceAlpha',0.8)
    legendname{i+2} = ['label=',num2str(i)];
end
legend(legendname,'Location','northoutside','NumColumns',6)
title('贴上标签后')
hold off
总结:原来设想的是聚成不同的类后,在装车时从每次都从不同的类中选择一个客户点,使得每辆车尽量均匀的包含不同的类中的客户。目前,目前还没有时间继续探究,等到有时间了继续探索将优化与机器学习结合的方法。