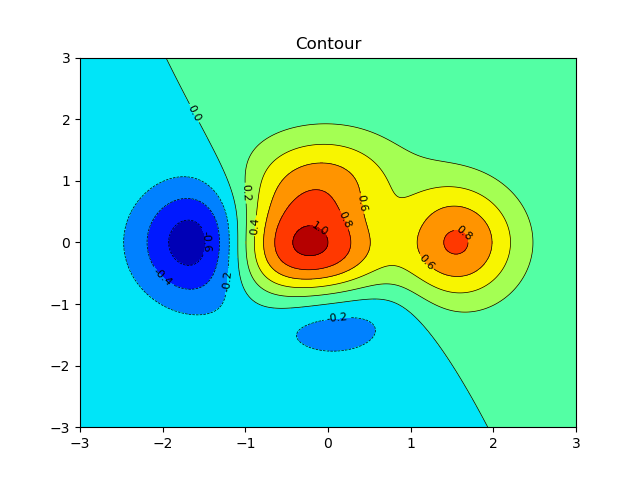
import numpy as np
import matplotlib.pyplot as mp

# 整理数据
n = 500
x, y = np.meshgrid(np.linspace(-3, 3, n),
                   np.linspace(-3, 3, n))
# print(x)
z = (1 - x / 2 + x ** 5 + y ** 3) * np.exp(-x ** 2 - y ** 2)

mp.figure('Contour', facecolor='lightgray')
mp.title('Contour')
cntr = mp.contour(x, y, z, 8, colors='black', linewidths=0.5)
mp.clabel(cntr, inline_spacing=0.5, fmt='%.1f', fontsize=8)
mp.contourf(x, y, z, 8, cmap='jet')
mp.show()