后端项目地址:https://gitee.com/wlovet/table-server
前端项目地址: https://gitee.com/wlovet/table-project
一、Render函数之Table加入IVIEW组件与表格修改
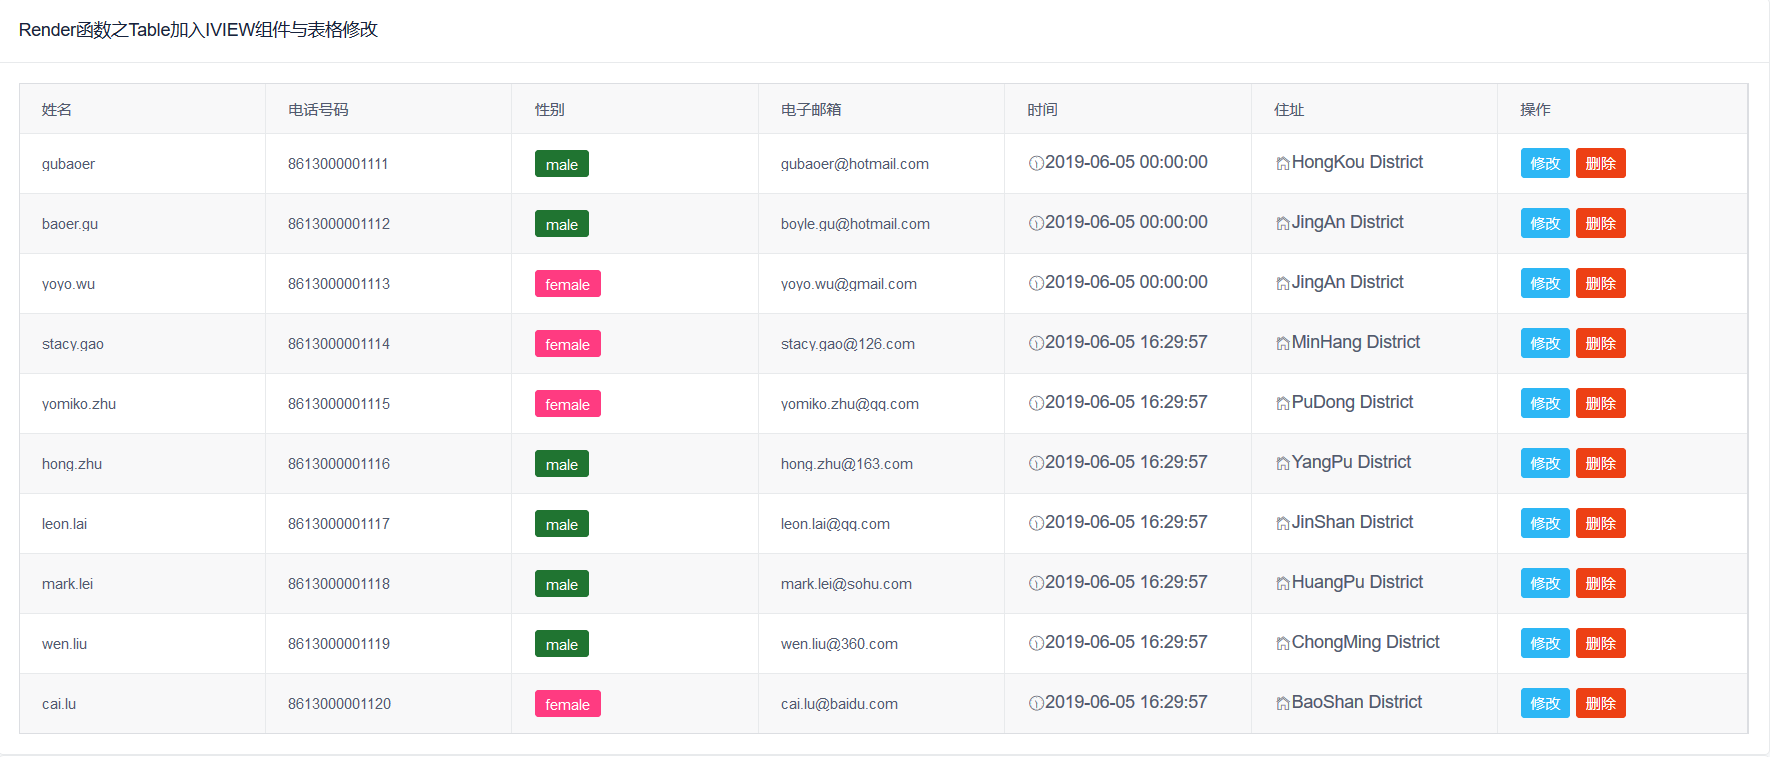
render函数可以在表格中除了可以加入html组件还有iview组件,使用方法是在定义列的时候使用元素构造对象h渲染新元素
1 render:(h,params)=>{
2   return h('div',{
3   props:{
4   },
5    style:{
6    }
7   },params.row)
8 }
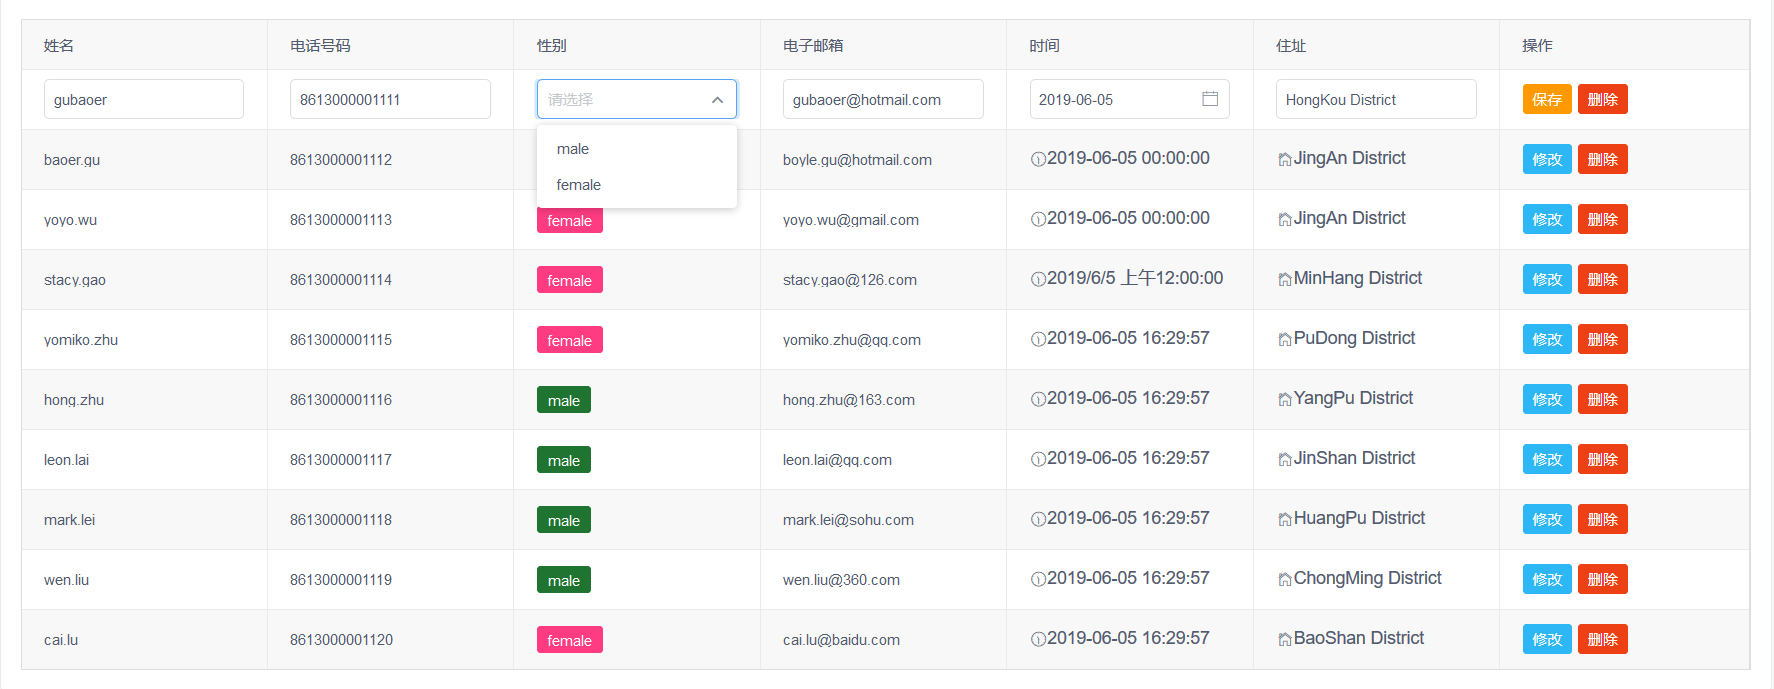
支持修改则在表格列中加入
 1 {
 2   title: '操作',
 3   key: 'action',
 4   width: 200,
 5   render: (h, params) => {
 6     return h('div', [
 7       h('Button', {
 8         props: {
 9           type: params.row.$isEdit ? 'warning' : 'info',
10           size: 'small',
11           icon: ''
12         },
13         style: {
14           marginRight: '5px',
15         },
16         on: {
17           click: () => {
18             if (params.row.$isEdit) {
19               this.handleSave(params.row);
20             } else {
21               this.handleEdit(params.row);
22             }
23           }
24         }
25       },params.row.$isEdit? '保存':'修改'),
26       h('Poptip', {
27         props: {
28           confirm: true,
29           title: '是否要删除此字段?',
30           transfer: true
31         },
32         on: {
33           'on-ok': () => {
34            //删除逻辑
35           }
36         },
37       }, [
38         h('Button', {
39           props: {
40             type: 'error',
41             size: 'small'
42           },
43           style: {
44             marginRight: '5px'
45           },
46         }, '删除')
47       ]),
48     ])
49   }
50 }
在methods属性中加入两个方法handleEdit、handleSave
1 //点击了修改按钮
2 handleEdit(row) {
3   this.$set(row, "$isEdit", true);
4 },
5 //点击了保存按钮
6 handleSave(row) {
7   this.$set(row, "$isEdit", false);
8 }
二、Render函数之Table单元格加入EChart图表
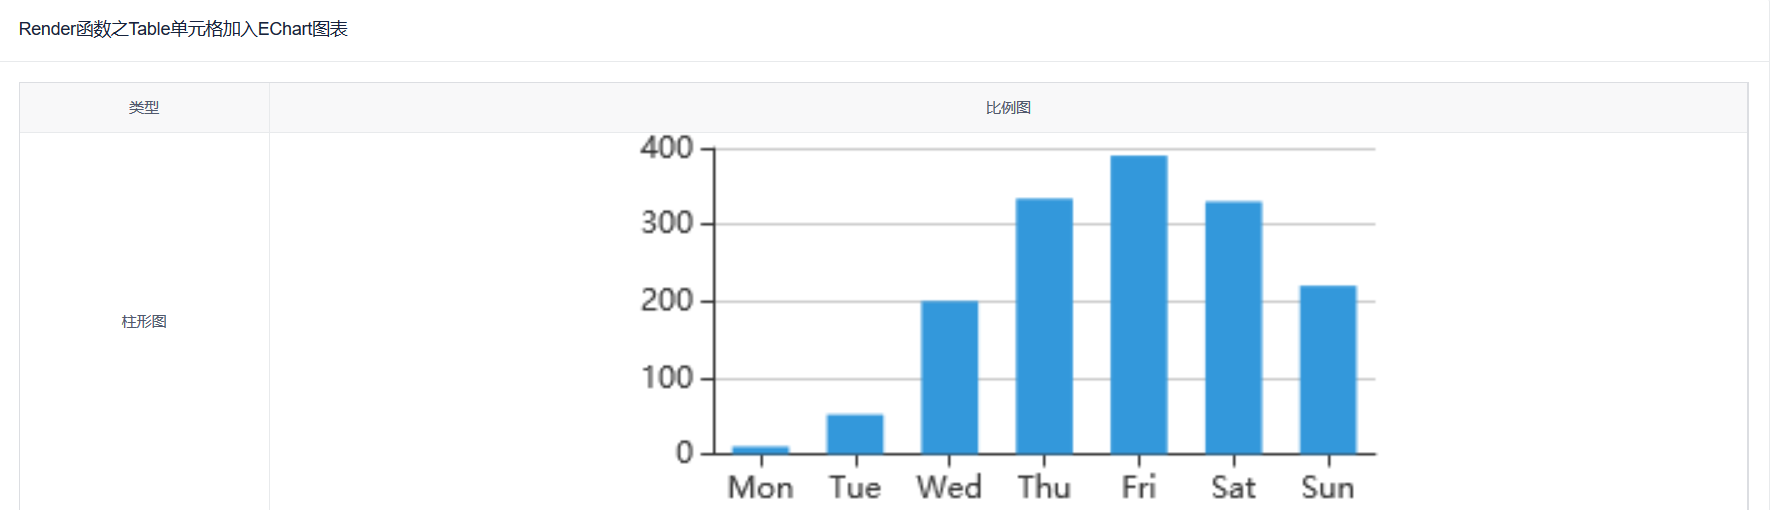
在单元格加入Echarts,首先导入加入echars包
1 //使用npm或cnpm下载echarts
2 cnpm install echarts -D
3 //在src/main.js文件中引入
4 import echarts from 'echarts'
5 Vue.prototype.$echarts = echarts
其次,在定义表格的列时
 1 {
 2   title: '比例图',
 3   align: 'center',
 4   render: (h, params) => {
 5     return h('div', [
 6       h('canvas', {
 7         style: {
 8           height: '300px',
 9           margin: '0',
10           padding: '0'
11         },
12         on: {},
13         attrs: {
14           //给单元格设置ID和类型
15           id: params.row.pictureType
16         }
17       })
18     ])
19   }
20 }
再次,在updated函数中使用echarts进行绘制。此处不在mounted方法里使用,因为绘制echarts表格是第二次渲染节点
1 updated() {
2   let self = this
3   self.pictureData.forEach((value, index) => {
4     self.paintChart(index, value)
5   })
6 }
最后在methods中加入方法paintChart
 1 //绘制图表
 2 paintChart(i, params) {
 3   if (params.pictureType === '柱形图') {
 4     let chart = this.$echarts.init(document.getElementById(params.pictureType));
 5       let option = {
 6         color: ['#3398DB'],
 7         tooltip: {
 8           trigger: 'axis',
 9           axisPointer: {            // 坐标轴指示器,坐标轴触发有效
10             type: 'shadow'        // 默认为直线,可选为:'line' | 'shadow'
11           }
12         },
13         grid: {
14           top: '4%',
15           left: '1%',
16           right: '1%',
17           bottom: '1%',
18           containLabel: true
19         },
20         xAxis: [
21           {
22             type: 'category',
23             data: ['Mon', 'Tue', 'Wed', 'Thu', 'Fri', 'Sat', 'Sun'],
24             axisTick: {
25               alignWithLabel: true
26             }
27           }
28         ],
29         yAxis: [
30           {
31             type: 'value'
32           }
33         ],
34         series: [
35           {
36             name: '直接访问',
37             type: 'bar',
38             barWidth: '60%',
39             data: [10, 52, 200, 334, 390, 330, 220]
40           }
41         ]
42       };
43       chart.setOption(option)
44     }
45   }
46 }