文章目录
接上一篇: k8s入门:kube-prometheus-stack 全家桶搭建(Grafana + Prometheus),监控 k8s 集群所有资源,我的集群是虚拟机搭建的,下面监控本机(window系统)资源 Grafana+Prometheus+Windows_exporter+Mysql_exporter
一、软件版本说明
- grafana:grafana-9.0.2
- prometheus:prometheus-2.36.2
- mysql:mysql-8.0.29-winx64
- windows_exporter:windows_exporter-0.18.1
- mysqld_exporter:mysqld_exporter-0.14.0
二、Grafana 安装
(可以选择不安装,直接使用 kube-prometheus-stack 全家桶自带的 Grafana),安装如下
下载地址:https://grafana.com/grafana/download?pg=get&plcmt=selfmanaged-box1-cta1&platform=windows
可选择对应系统指定版本下载,我下载的压缩包,安装简单直接解压即可
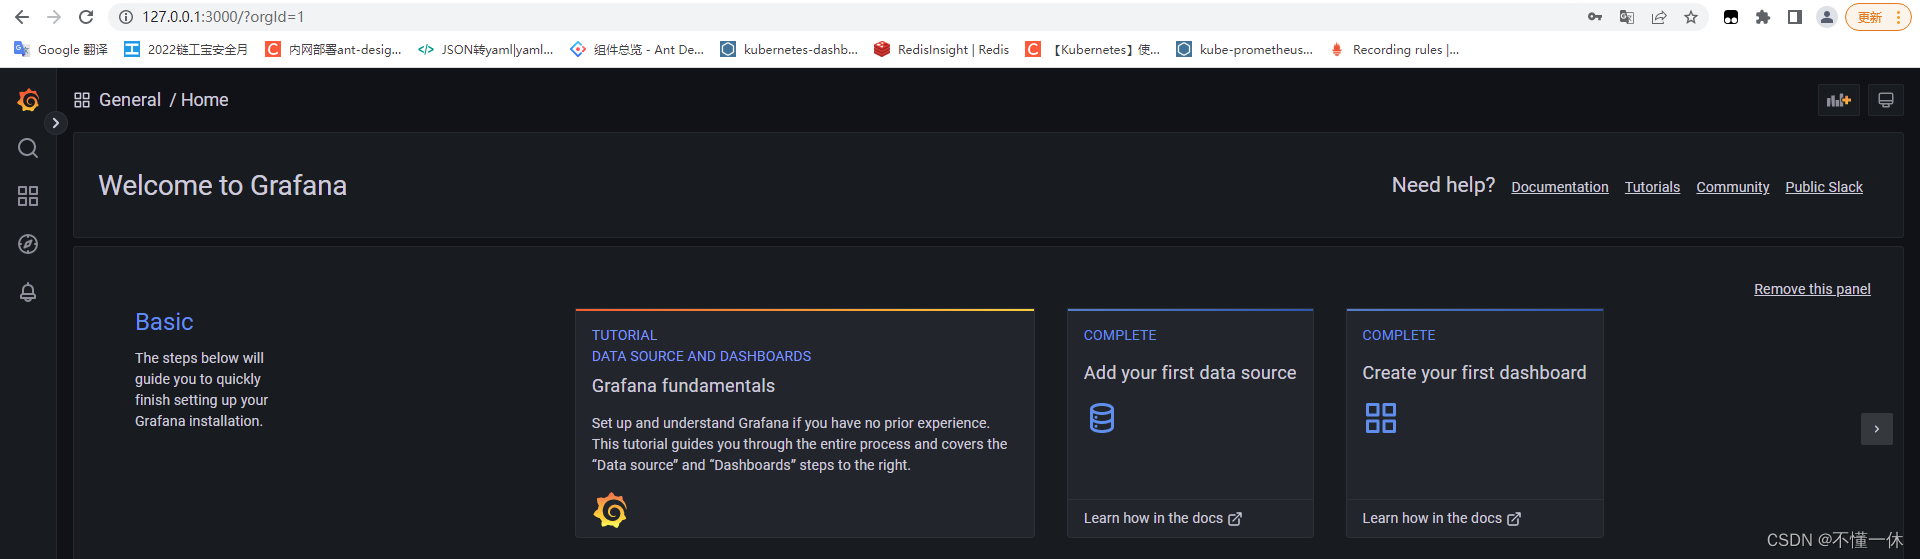
访问 http://127.0.0.1:3000/ ,用户名/密码 admin/admin
三、Prometheus、Mysql_exporter、Windows_exporter 安装
1、下载
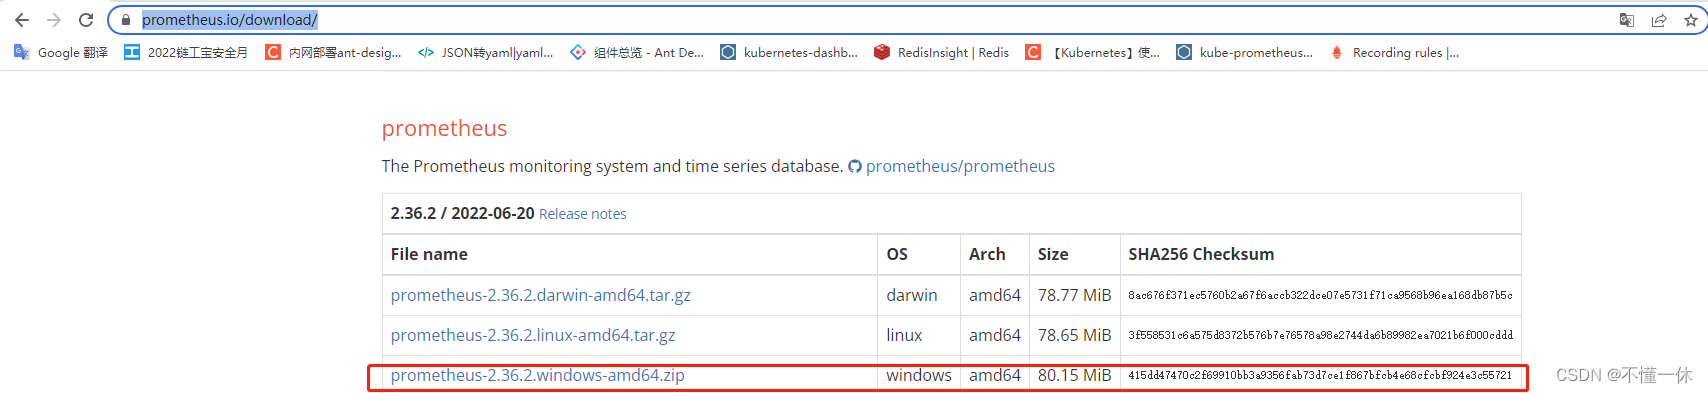
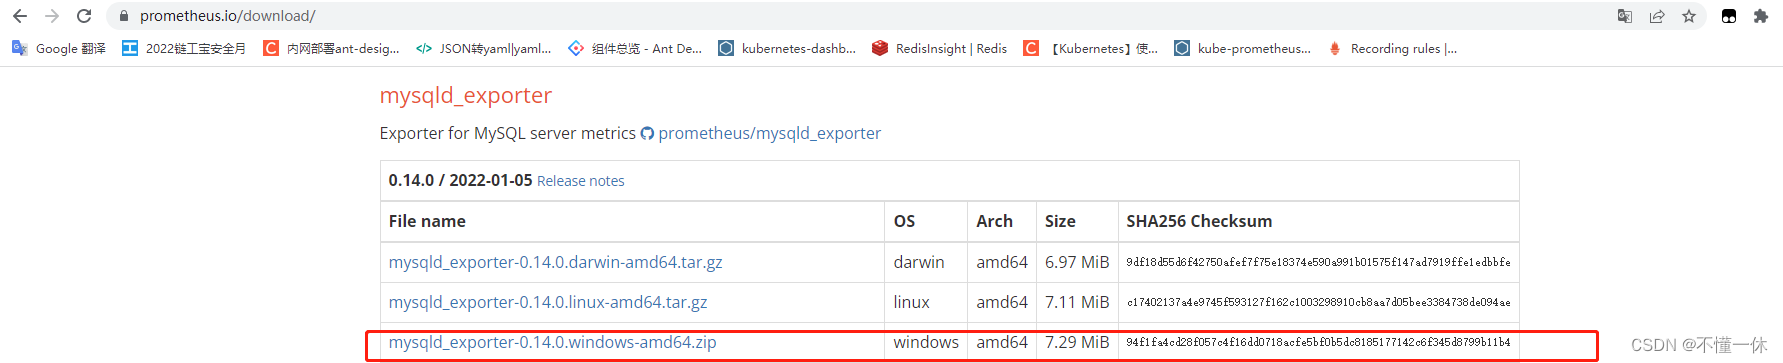
Prometheus 、Mysql_exporter 下载地址:https://prometheus.io/download/
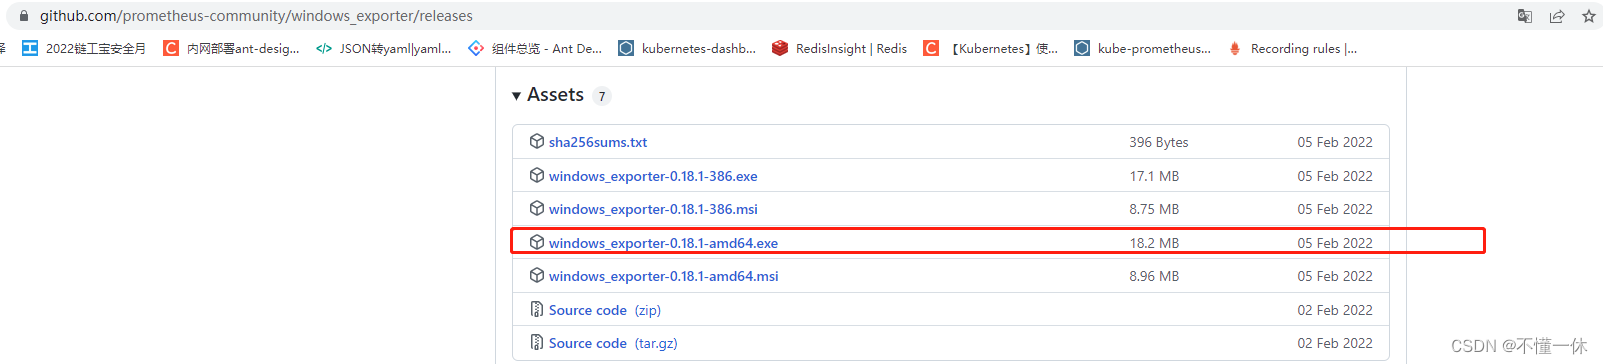
Windows_exporter 下载地址:https://github.com/prometheus-community/windows_exporter/releases
2、安装启动
①、Mysql_exporter
详细信息参考:https://github.com/prometheus/mysqld_exporter
如果要安装 MySQL 可参考:MySQL安装
mysql 新增 exporter 用户(非必要)
# 建议为用户设置最大连接限制,以避免在重负载下监控抓取使服务器过载:如设置最大连接 3
CREATE USER 'exporter'@'localhost' IDENTIFIED BY '123456' WITH MAX_USER_CONNECTIONS 3;
GRANT PROCESS, REPLICATION CLIENT, SELECT ON *.* TO 'exporter'@'localhost';
解压完成,进入安装目录,新增配置文件 my.cnf,添加如下参数(可以使用 root 用户)
[client]
host = 127.0.0.1
user = exporter
password = 123456
进入安装目录,指定配置文件启动.\mysqld_exporter.exe --config.my-cnf=my.cnf
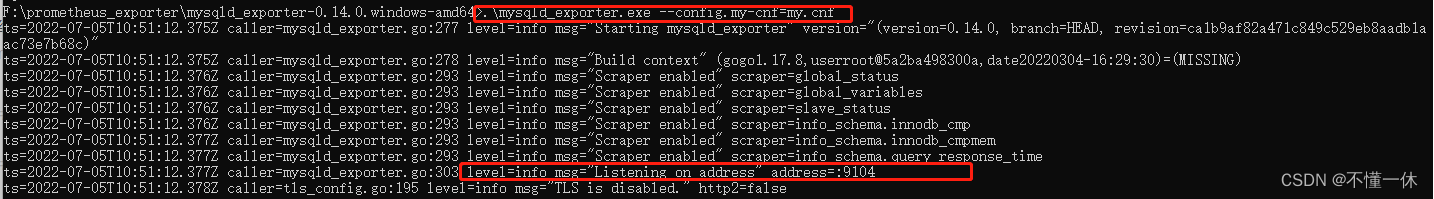
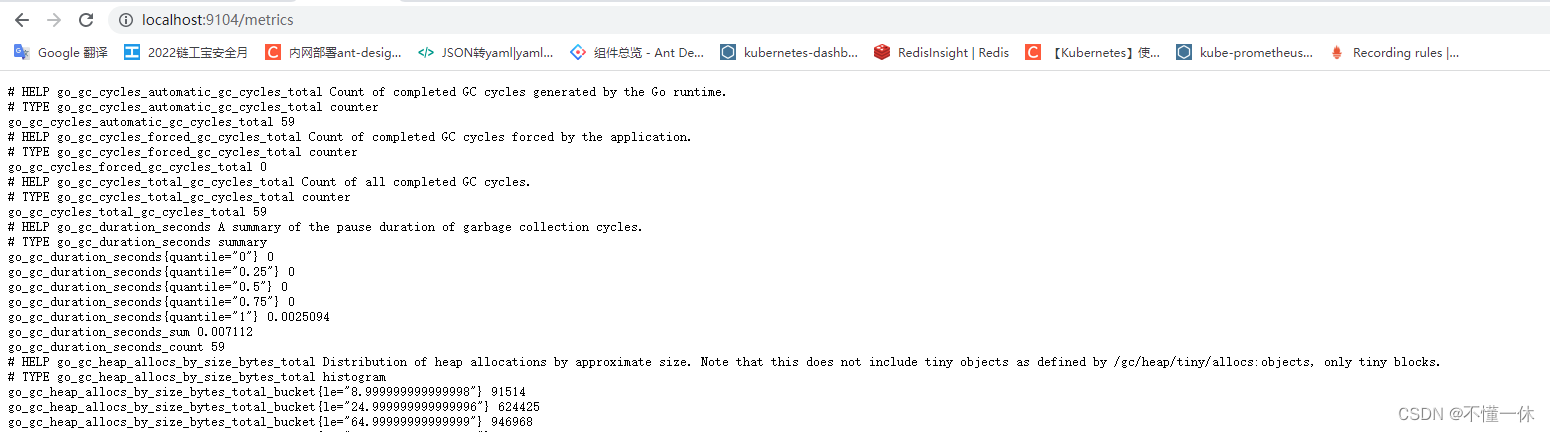
访问 http://localhost:9104/metrics 保证能正常采集数据
②、Windows_exporter
详细信息参考:https://github.com/prometheus-community/windows_exporter/releases
进入安装目录,启动 .\windows_exporter-0.18.1-amd64.exe
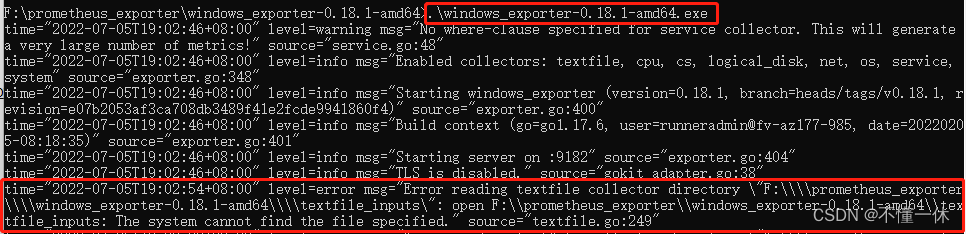
解决错误"Error reading textfile collector directory \"F:\\\\prometheus_exporter\\\\windows_exporter-0.18.1-amd64\\\\textfile_inputs\"
- 新建文件夹
F:\\prometheus_exporter\\windows_exporter-0.18.1-amd64\\textfile_inputs,重启即可
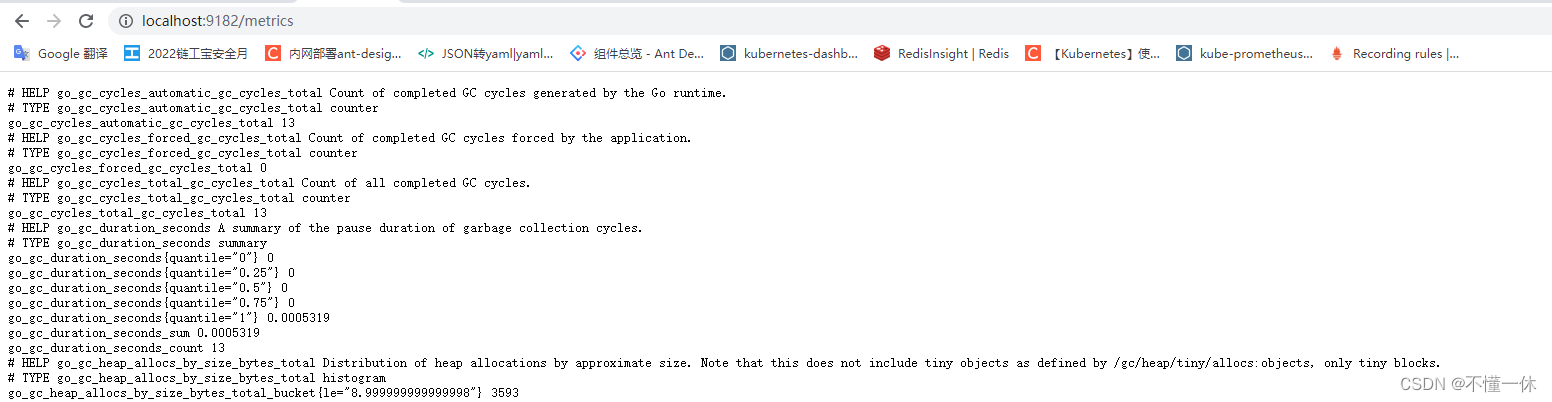
访问 http://localhost:9182/metrics 保证能正常采集数据
③、Prometheus
详细信息参考:https://github.com/prometheus/prometheus
下载解压完成,可以看到文件夹自带一个配置文件 prometheus.yml ,详细配置可以查看 https://prometheus.io/docs/prometheus/latest/configuration/configuration/
配置文件 prometheus.yml 添加对 mysql 和 window 的数据采集
# my global config
global:
  scrape_interval: 15s # Set the scrape interval to every 15 seconds. Default is every 1 minute.
  evaluation_interval: 15s # Evaluate rules every 15 seconds. The default is every 1 minute.

# Alertmanager configuration
alerting:
  alertmanagers:
    - static_configs:
        - targets:
          # - alertmanager:9093

rule_files:
  # - "first_rules.yml"
  # - "second_rules.yml"

scrape_configs:
  - job_name: "prometheus"
    static_configs:
      - targets: ["localhost:9090"]
  # 添加对 window 系统的数据采集
  - job_name: "windows_exporter"
    static_configs:
      - targets: ["localhost:9182"]
  # 添加对 mysql 的数据采集
  - job_name: "mysql_exporter"
    static_configs:
      - targets: ["localhost:9104"]
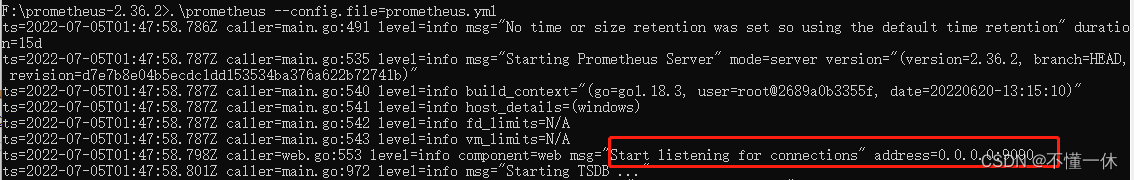
指定配置文件启动.\prometheus --config.file=prometheus.yml
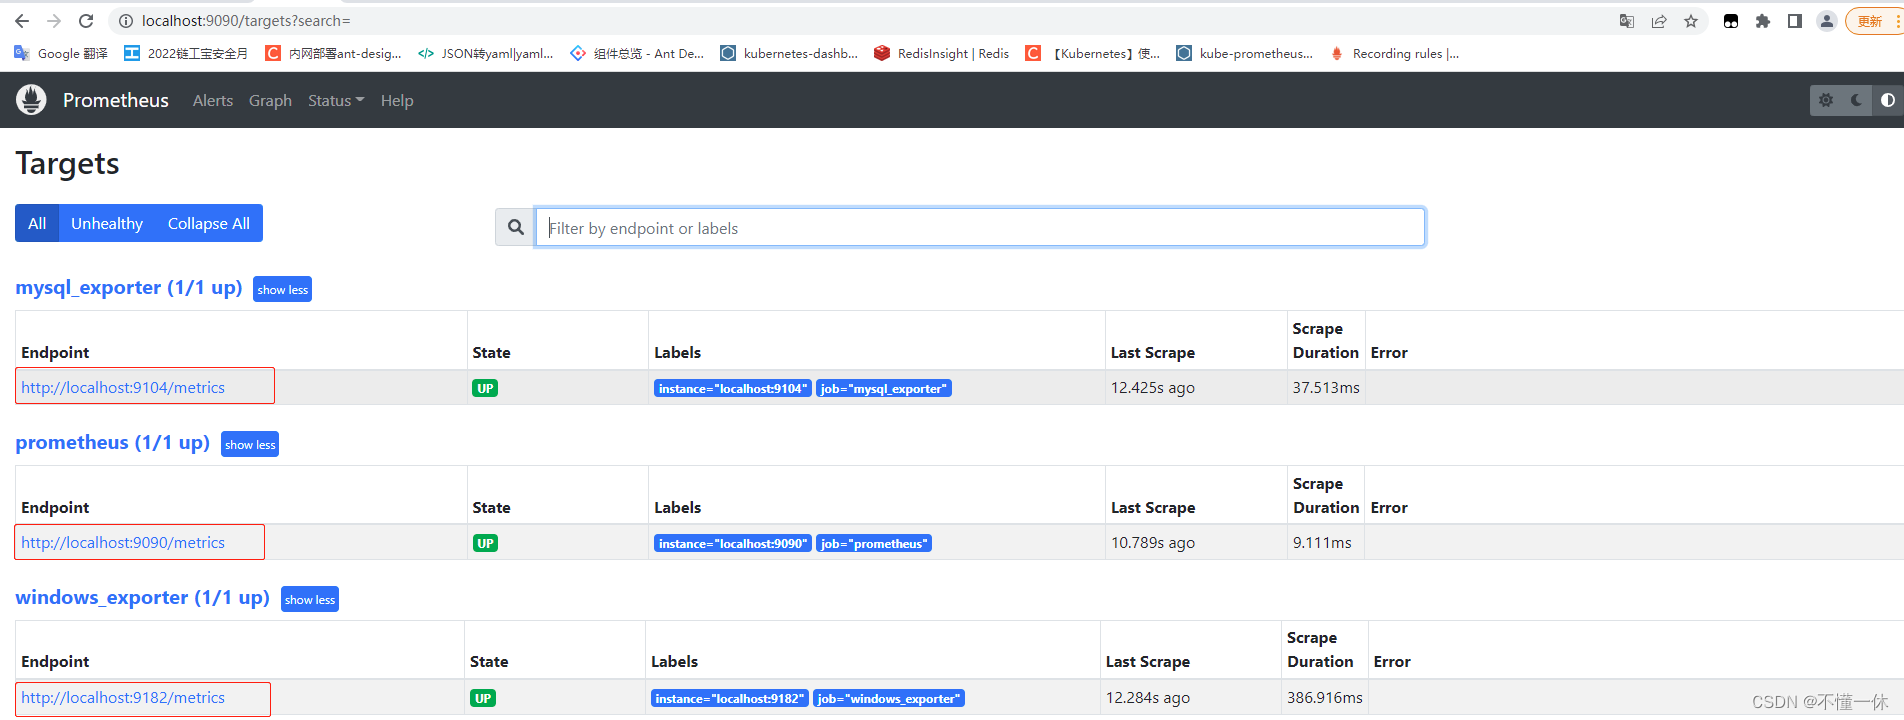
访问测试,点击链接保证能正常采集到数据
三、mysql 安装
1、下载
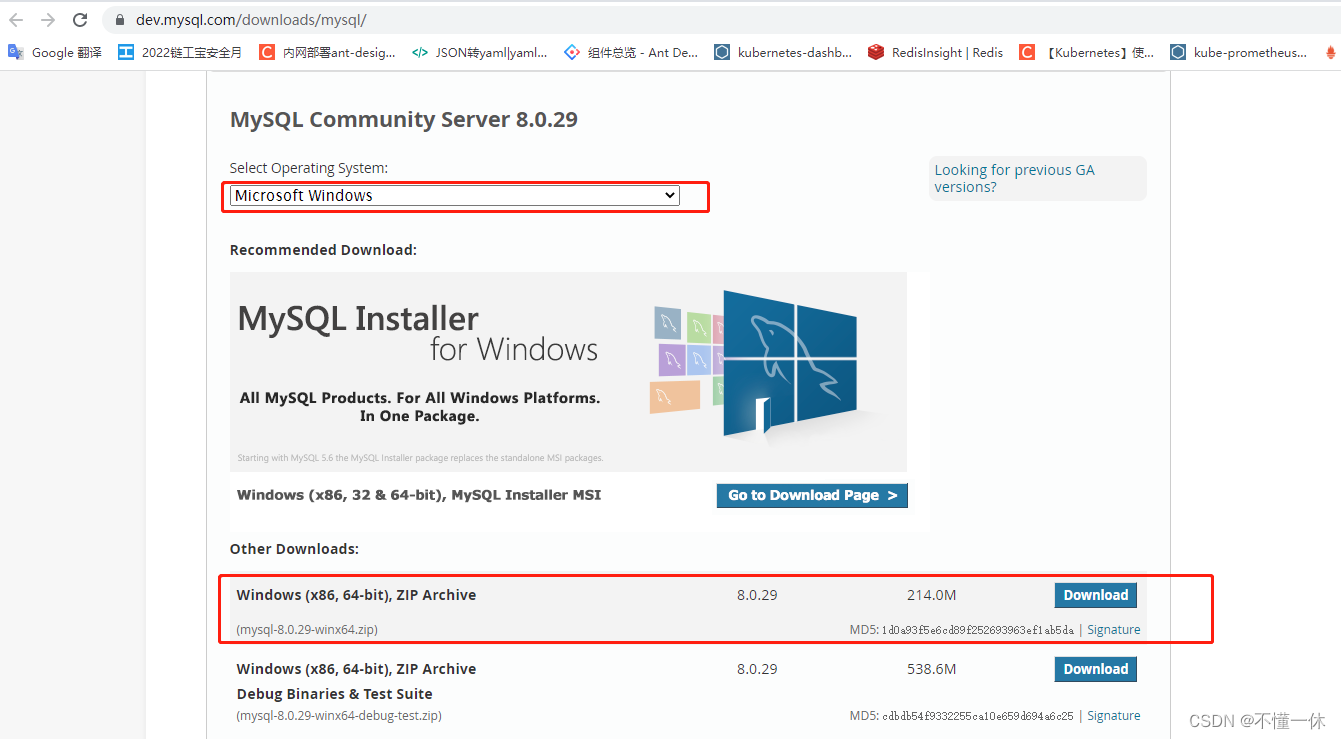
选择压缩包安装,下载地址:https://dev.mysql.com/downloads/mysql/,选择对应系统指定版本
2、添加配置文件
进入解压目录 F:\mysql-8.0.29-winx64,添加配置文件 F:\mysql-8.0.29-winx64\my.ini,添加如下信息
[client]
# 设置mysql客户端默认字符集
default-character-set=utf8

[mysqld]
# 设置3306端口
port = 3306
# 设置mysql的安装目录
basedir=F:\mysql-8.0.29-winx64
# 设置 mysql数据库的数据的存放目录,MySQL 8+ 不需要以下配置,系统自己生成即可,否则有可能报错
# datadir=F:\mysql-8.0.29-winx64\data
# 允许最大连接数
max_connections=20
# 服务端使用的字符集默认为8比特编码的latin1字符集
character-set-server=utf8
# 创建新表时将使用的默认存储引擎
default-storage-engine=INNODB
3、启动并连接测试
初始化数据库
mysqld --initialize --console
执行完成后,会输出 root 用户的初始默认密码,如:
2022-07-06T11:35:05.464644Z 5 [Note] [MY-010454] [Server] A temporary password is generated for root@localhost: YsdYopws&hKl
YsdYopws&hKl 就是初始密码,后续登录需要用到,你需要在登陆后修改密码。
创建启动mysql
# 创建 mysqld  服务
mysqld install
# 启动 mysqld 服务
net start mysql
命令连接测试(需要添加环境变量可以将 bin 目录加入 path 中)
# 连接 mysql ,密码为上面初始化保存的密码
mysql -u root -p
连接成功之后查询命令应该会报错,需要修改 root 密码(截图找不到了),输入如下命令修改密码
# 更新用户的密码
ALTER USER 'root'@'localhost' IDENTIFIED WITH mysql_native_password BY '123456';
四、仪表盘
1、查找仪表盘
Grafana 查询仪表盘官网:https://grafana.com/grafana/dashboards/
Mysql_exporter 仪表盘
Windows_exporter 仪表盘
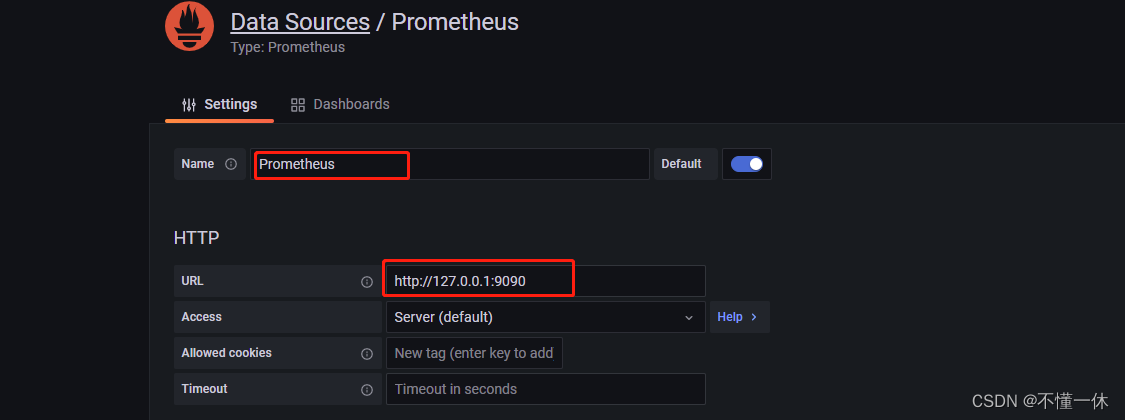
2、添加数据源
Grafana 添加 Prometheus 数据源 http://127.0.0.1:3000/datasources
点击添加数据源,选择 Prometheus 数据源,添加如下参数,其他参数可使用默认值
3、grafana 导入仪表盘
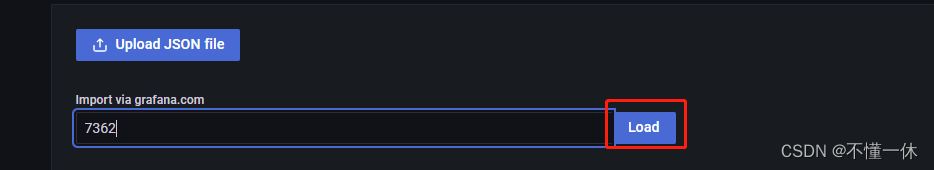
grafana 导入仪表盘可以使用 JSON、Dashboard URL 或 Dashboard id,我们使用 Dashboard id 导入
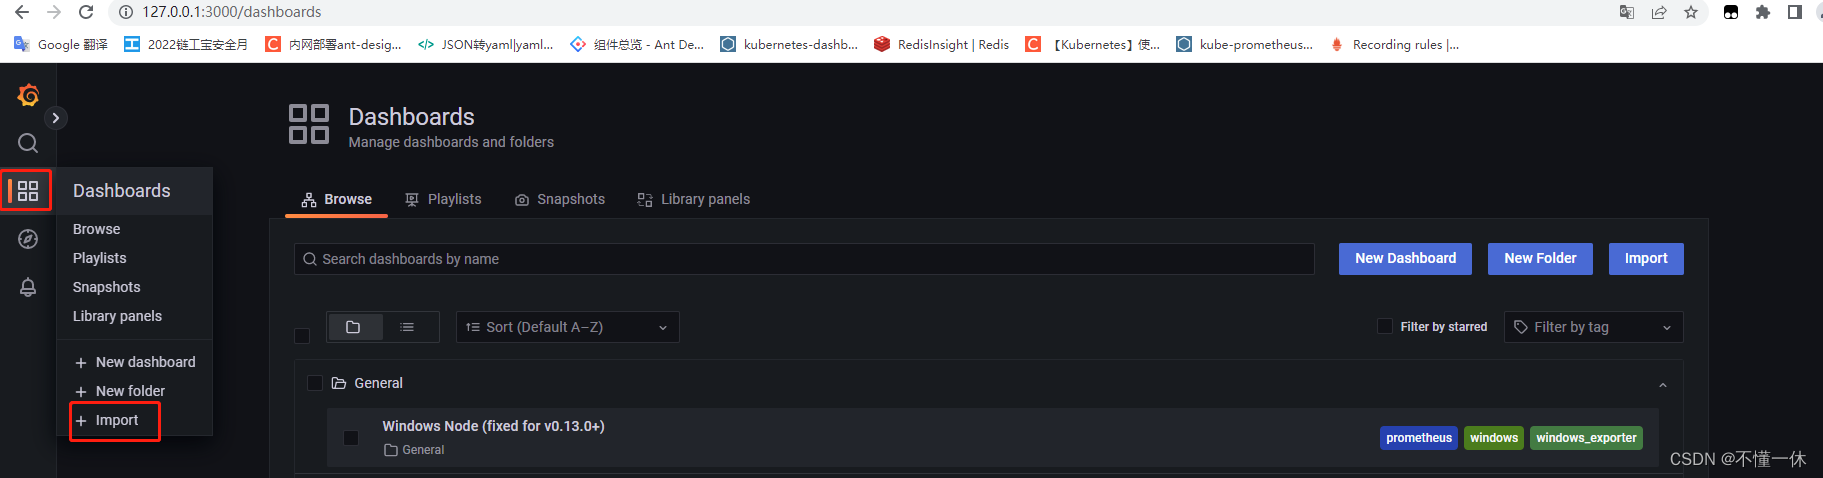
Dashboard id
- Mysql_exporter :7362
- Windows_exporter :10467
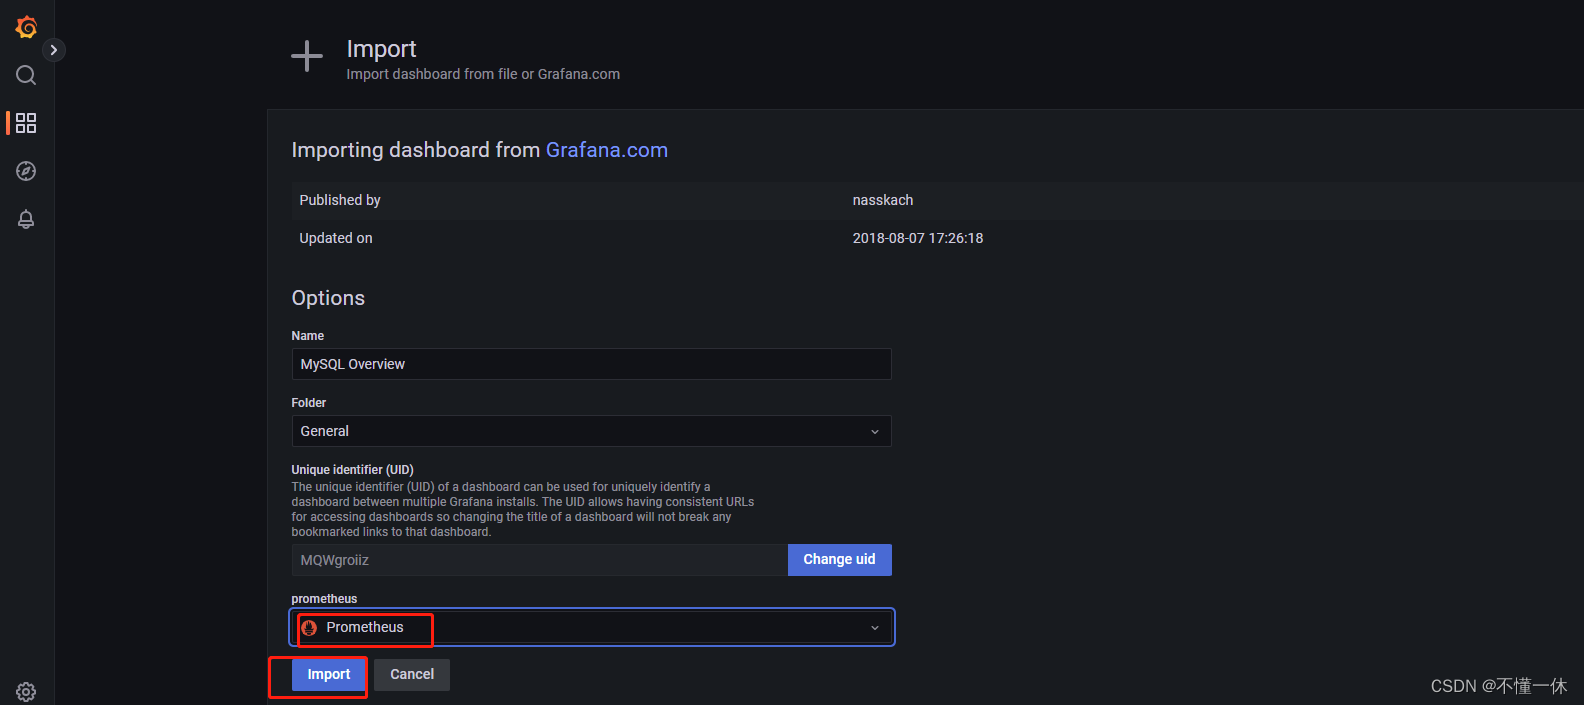
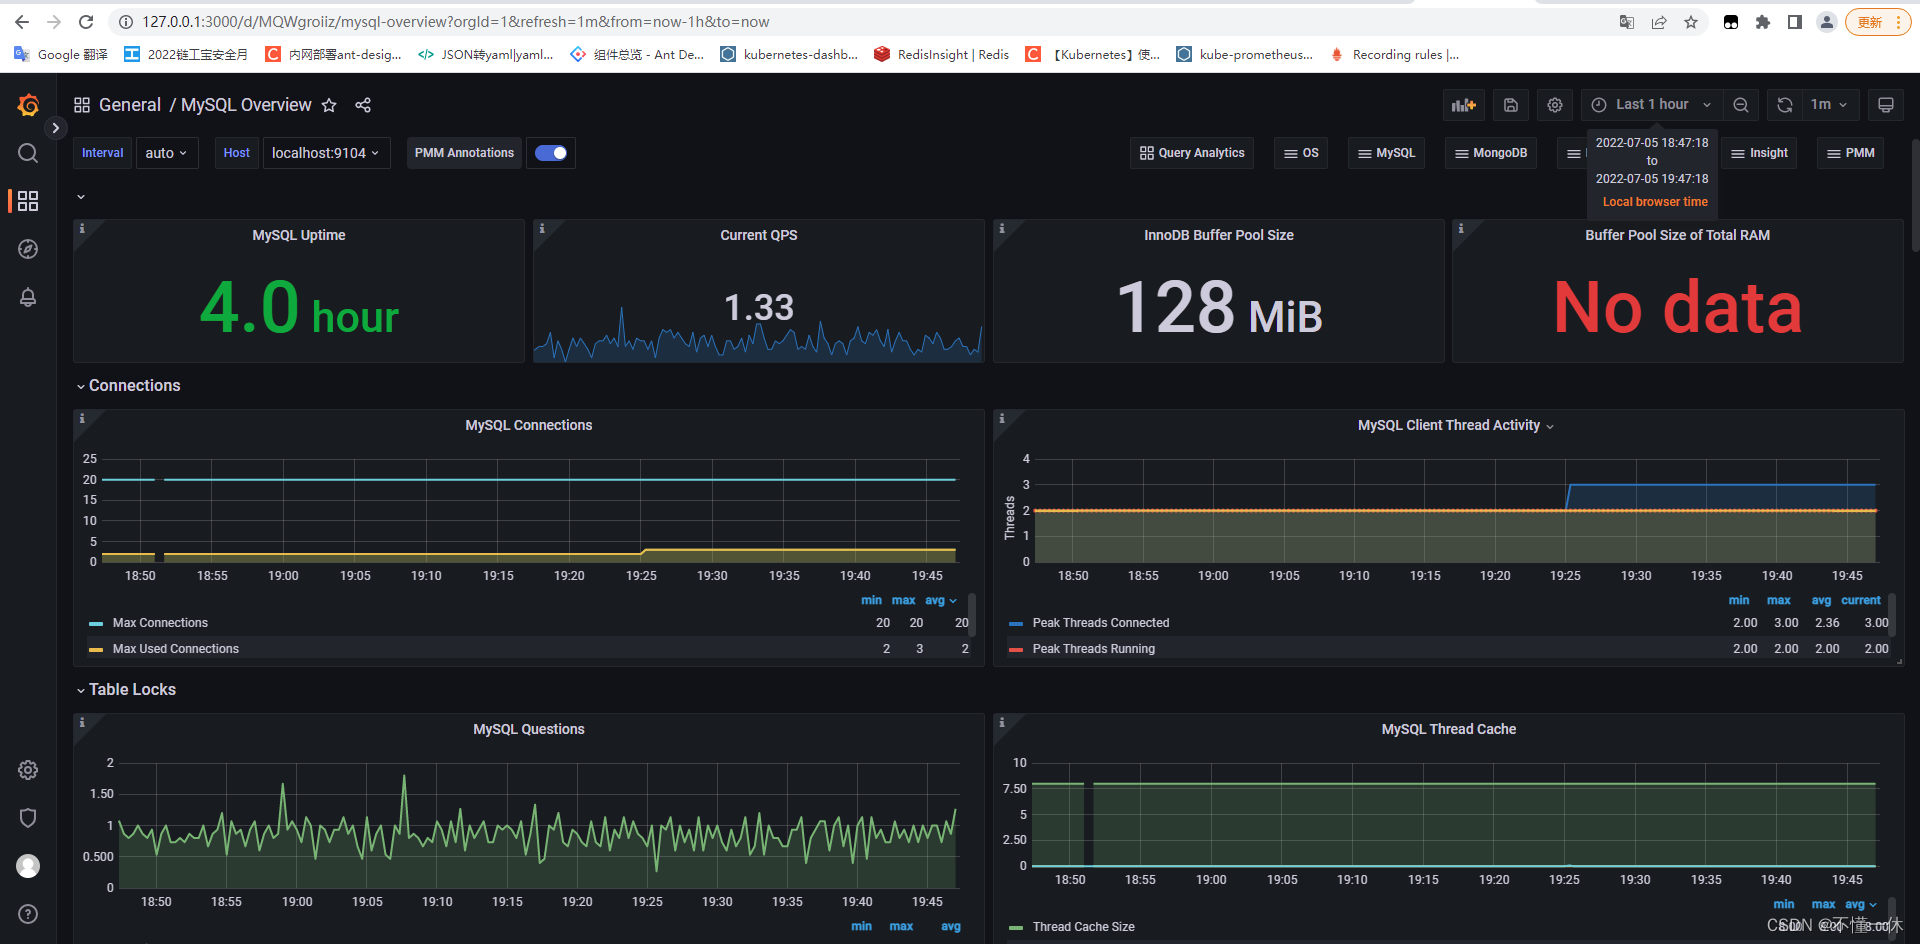
导入 Mysql_exporter 仪表盘如下,Windows_exporter 操作类似
选择数据源导入
4、查看仪表盘
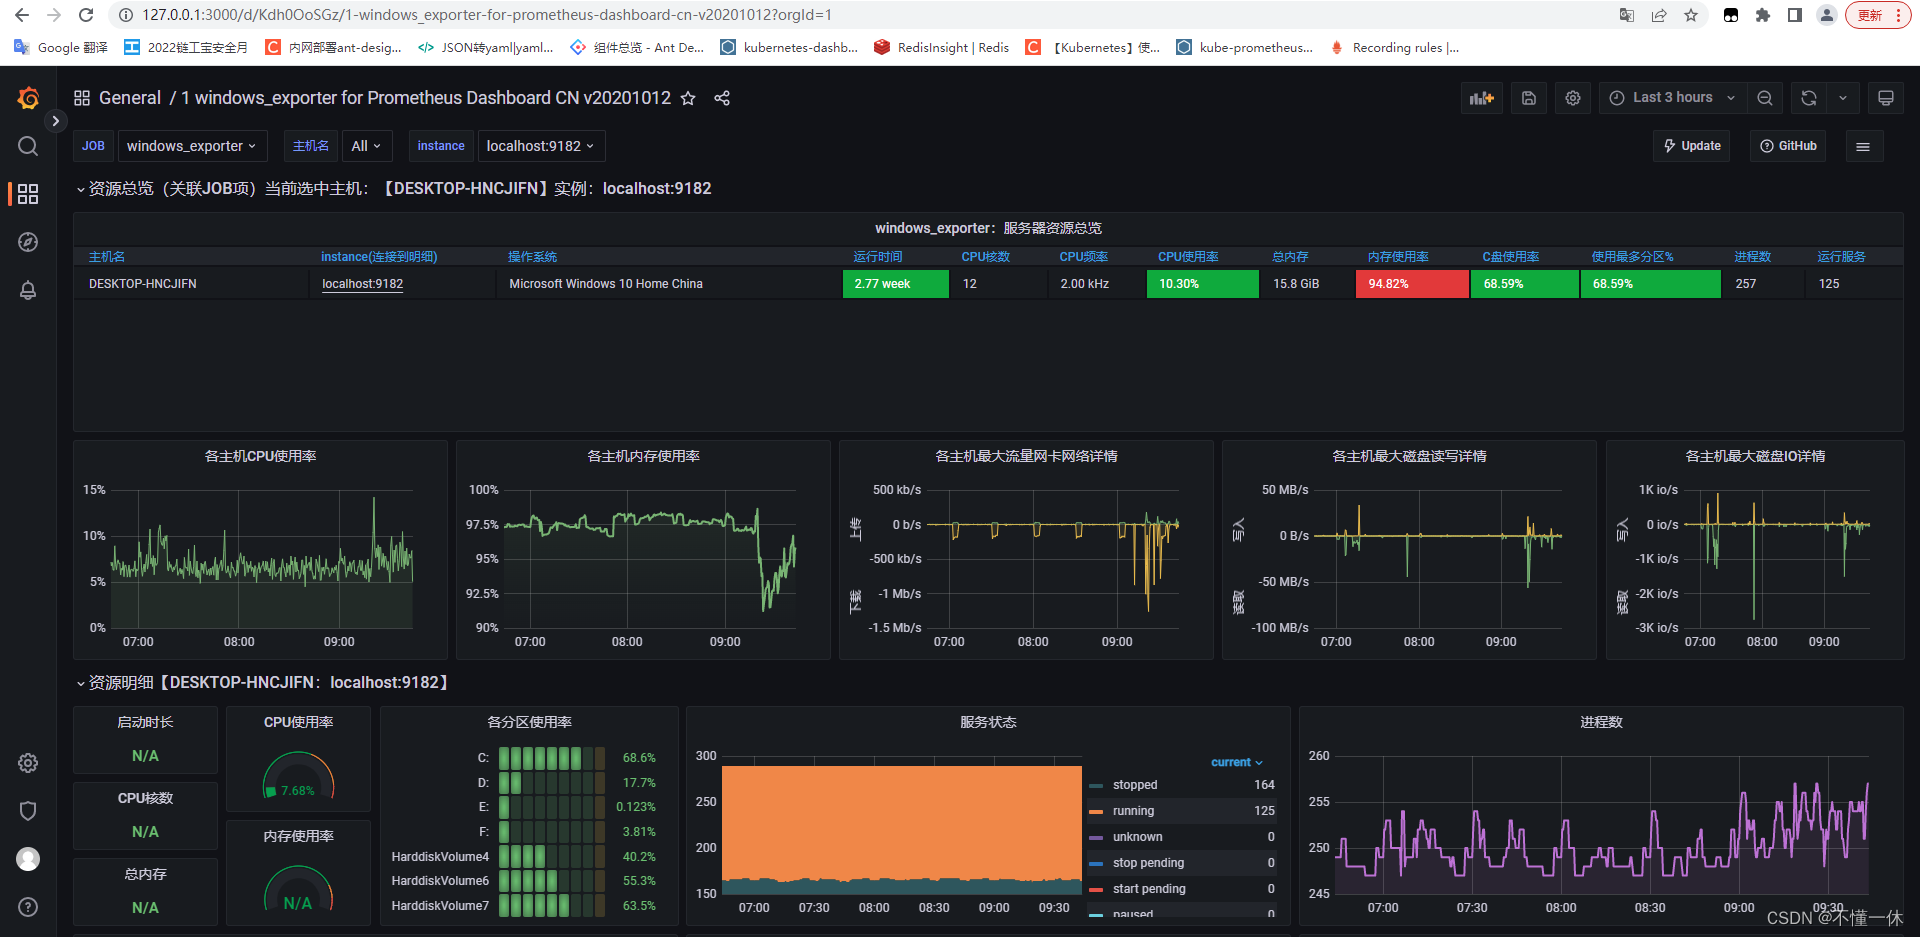
MySQL
Window