▶ 使用神经网络来为散点作分类
● 单层感知机,代码
  1 import numpy as np
  2 import matplotlib.pyplot as plt
  3 from mpl_toolkits.mplot3d import Axes3D
  4 from mpl_toolkits.mplot3d.art3d import Poly3DCollection
  5 from matplotlib.patches import Rectangle
  6
  7 dataSize = 2000
  8 trainRatio = 0.3
  9 ita = 0.3
 10 epsilon = 0.001
 11 maxTurn = 300
 12
 13 colors = [[0.5,0.25,0],[1,0,0],[0,0.5,0],[0,0,1],[1,0.5,0]] # 棕红绿蓝橙
 14 trans = 0.5
 15
 16 def dataSplit(data, part):                                  # 将数据集分割为训练集和测试集
 17     return data[0:part,:],data[part:,:]
 18
 19 def mySign(x):                                              # 区分 np.sign()
 20     return (1 + np.sign(x))/2
 21
 22 def function(x,para):                                       # 连续回归函数,用于画图
 23     return np.sum(x * para[0]) - para[1]                    # 注意是减号
 24
 25 def judge(x, para):                                         # 分类函数,由乘加部分和阈值部分组成
 26     return mySign(function(x, para))
 27
 28 def createData(dim, len):                                   # 生成测试数据
 29     np.random.seed(103)
 30     output=np.zeros([len,dim+1])
 31     for i in range(dim):
 32         output[:,i] = np.random.rand(len)
 33     output[:,dim] = list(map(lambda x : int(x > 0.5), (3 - 2 * dim)*output[:,0] + 2 * np.sum(output[:,1:dim], 1)))
 34     #print(output, "\n", np.sum(output[:,-1])/len)
 35     return output
 36
 37 def perceptron(data):                                       # 单层感知机
 38     len = np.shape(data)[0]
 39     dim = np.shape(data)[1] - 1
 40     xE = np.concatenate((data[:, 0:-1], -np.ones(len)[:,np.newaxis]), axis = 1)
 41     w = np.zeros(dim + 1)
 42     finishFlag = False
 43     count = 0
 44     while finishFlag == False and count < maxTurn:
 45         error = 0.0
 46         for i in range(len):
 47             delta = ita * (data[i,-1] - mySign(np.sum(xE[i] * w))) * xE[i]   # 注意 np.sign 的定义
 48             error += np.sum(delta * delta)
 49             w += delta
 50         count += 1
 51         print("count = ",count,", w = ", w, ", error = ", error)
 52         if error < epsilon:
 53             finishFlag = True
 54             break
 55     return (w[:-1],w[-1])
 56
 57 def test(dim):                                              # 测试函数
 58     allData = createData(dim, dataSize)
 59     trainData, testData = dataSplit(allData, int(dataSize * trainRatio))
 60
 61     para = perceptron(trainData)
 62
 63     myResult = [ judge(i[0:dim], para) for i in testData ]
 64     errorRatio = np.sum((np.array(myResult) - testData[:,-1].astype(int))**2) / (dataSize*(1-trainRatio))
 65     print("dim = "+ str(dim) + ", errorRatio = " + str(round(errorRatio,4)))
 66     if dim >= 4:                                            # 4维以上不画图,只输出测试错误率
 67         return
 68
 69     errorP = []                                             # 画图部分,测试数据集分为错误类,1 类和 0 类
 70     class1 = []
 71     class0 = []
 72     for i in range(np.shape(testData)[0]):
 73         if myResult[i] != testData[i,-1]:
 74             errorP.append(testData[i])
 75         elif myResult[i] == 1:
 76             class1.append(testData[i])
 77         else:
 78             class0.append(testData[i])
 79     errorP = np.array(errorP)
 80     class1 = np.array(class1)
 81     class0 = np.array(class0)
 82
 83     fig = plt.figure(figsize=(10, 8))
 84
 85     if dim == 1:
 86         plt.xlim(0.0,1.0)
 87         plt.ylim(-0.25,1.25)
 88         plt.plot([0.5, 0.5], [-0.5, 1.25], color = colors[0],label = "realBoundary")
 89         plt.plot([0, 1], [ function(i, para) for i in [0,1] ],color = colors[4], label = "myF")
 90         plt.scatter(class1[:,0], class1[:,1],color = colors[1], s = 2,label = "class1Data")
 91         plt.scatter(class0[:,0], class0[:,1],color = colors[2], s = 2,label = "class0Data")
 92         if len(errorP) != 0:
 93             plt.scatter(errorP[:,0], errorP[:,1],color = colors[3], s = 16,label = "errorData")
 94         plt.text(0.2, 1.12, "realBoundary: 2x = 1\nmyF(x) = " + str(round(para[0][0],2)) + " x - " + str(round(para[1],2)) + "\n errorRatio = " + str(round(errorRatio,4)),\
 95             size=15, ha="center", va="center", bbox=dict(boxstyle="round", ec=(1., 0.5, 0.5), fc=(1., 1., 1.)))
 96         R = [Rectangle((0,0),0,0, color = colors[k]) for k in range(5)]
 97         plt.legend(R, ["realBoundary", "class1Data", "class0Data", "errorData", "myF"], loc=[0.81, 0.2], ncol=1, numpoints=1, framealpha = 1)
 98
 99     if dim == 2:
100         plt.xlim(0.0,1.0)
101         plt.ylim(0.0,1.0)
102         plt.plot([0,1], [0.25,0.75], color = colors[0],label = "realBoundary")
103         xx = np.arange(0, 1 + 0.1, 0.1)
104         X,Y = np.meshgrid(xx, xx)
105         contour = plt.contour(X, Y, [ [ function((X[i,j],Y[i,j]), para) for j in range(11)] for i in range(11) ])
106         plt.clabel(contour, fontsize = 10,colors='k')
107         plt.scatter(class1[:,0], class1[:,1],color = colors[1], s = 2,label = "class1Data")
108         plt.scatter(class0[:,0], class0[:,1],color = colors[2], s = 2,label = "class0Data")
109         if len(errorP) != 0:
110             plt.scatter(errorP[:,0], errorP[:,1],color = colors[3], s = 8,label = "errorData")
111         plt.text(0.75, 0.92, "realBoundary: -x + 2y = 1\nmyF(x,y) = " + str(round(para[0][0],2)) + " x + " + str(round(para[0][1],2)) + " y - " + str(round(para[1],2)) + "\n errorRatio = " + str(round(errorRatio,4)), \
112             size = 15, ha="center", va="center", bbox=dict(boxstyle="round", ec=(1., 0.5, 0.5), fc=(1., 1., 1.)))
113         R = [Rectangle((0,0),0,0, color = colors[k]) for k in range(4)]
114         plt.legend(R, ["realBoundary", "class1Data", "class0Data", "errorData"], loc=[0.81, 0.2], ncol=1, numpoints=1, framealpha = 1)
115
116     if dim == 3:
117         ax = Axes3D(fig)
118         ax.set_xlim3d(0.0, 1.0)
119         ax.set_ylim3d(0.0, 1.0)
120         ax.set_zlim3d(0.0, 1.0)
121         ax.set_xlabel('X', fontdict={'size': 15, 'color': 'k'})
122         ax.set_ylabel('Y', fontdict={'size': 15, 'color': 'k'})
123         ax.set_zlabel('W', fontdict={'size': 15, 'color': 'k'})
124         v = [(0, 0, 0.25), (0, 0.25, 0), (0.5, 1, 0), (1, 1, 0.75), (1, 0.75, 1), (0.5, 0, 1)]
125         f = [[0,1,2,3,4,5]]
126         poly3d = [[v[i] for i in j] for j in f]
127         ax.add_collection3d(Poly3DCollection(poly3d, edgecolor = 'k', facecolors = colors[0]+[trans], linewidths=1))
128         ax.scatter(class1[:,0], class1[:,1],class1[:,2], color = colors[1], s = 2, label = "class1")
129         ax.scatter(class0[:,0], class0[:,1],class0[:,2], color = colors[2], s = 2, label = "class0")
130         if len(errorP) != 0:
131             ax.scatter(errorP[:,0], errorP[:,1],errorP[:,2], color = colors[3], s = 8, label = "errorData")
132         ax.text3D(0.8, 1, 1.15, "realBoundary: -3x + 2y +2z = 1\nmyF(x,y,z) = " + str(round(para[0][0],2)) + " x + " + \
133             str(round(para[0][1],2)) + " y + " + str(round(para[0][2],2)) + " z - " + str(round(para[1],2)) + "\n errorRatio = " + str(round(errorRatio,4)), \
134             size = 12, ha="center", va="center", bbox=dict(boxstyle="round", ec=(1, 0.5, 0.5), fc=(1, 1, 1)))
135         R = [Rectangle((0,0),0,0, color = colors[k]) for k in range(4)]
136         plt.legend(R, ["realBoundary", "class1Data", "class0Data", "errorData"], loc=[0.83, 0.1], ncol=1, numpoints=1, framealpha = 1)
137
138     fig.savefig("R:\\dim" + str(dim) + ".png")
139     plt.close()
140
141 if __name__ == '__main__':
142     test(1)
143     test(2)
144     test(3)
145     test(4)
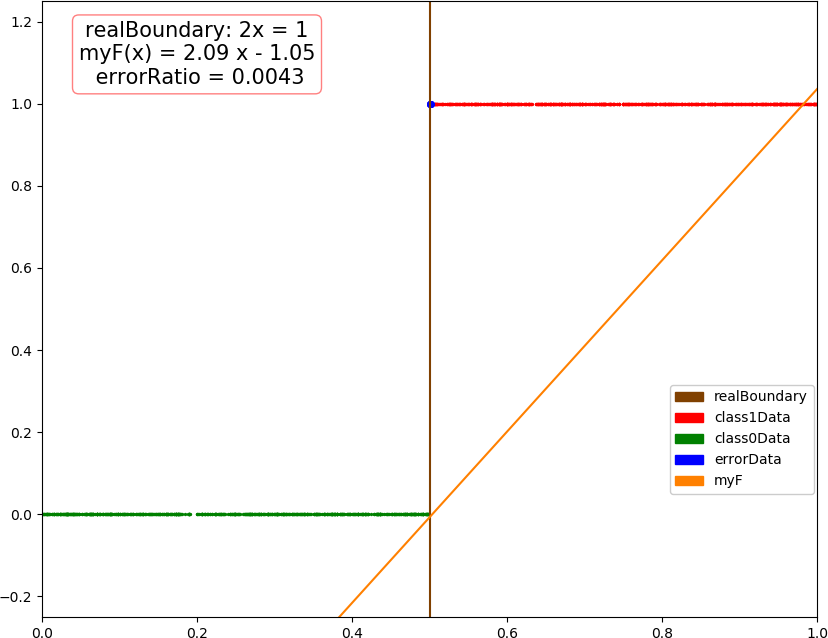
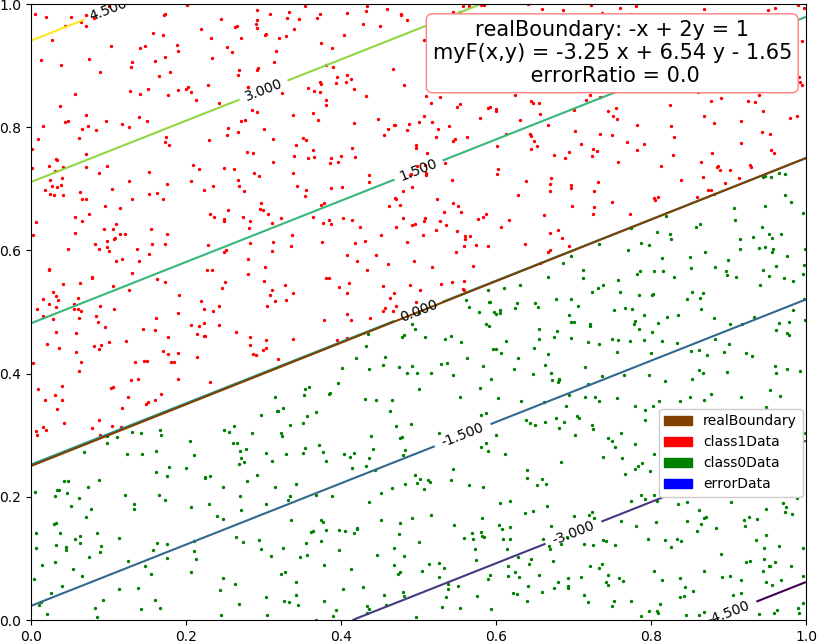
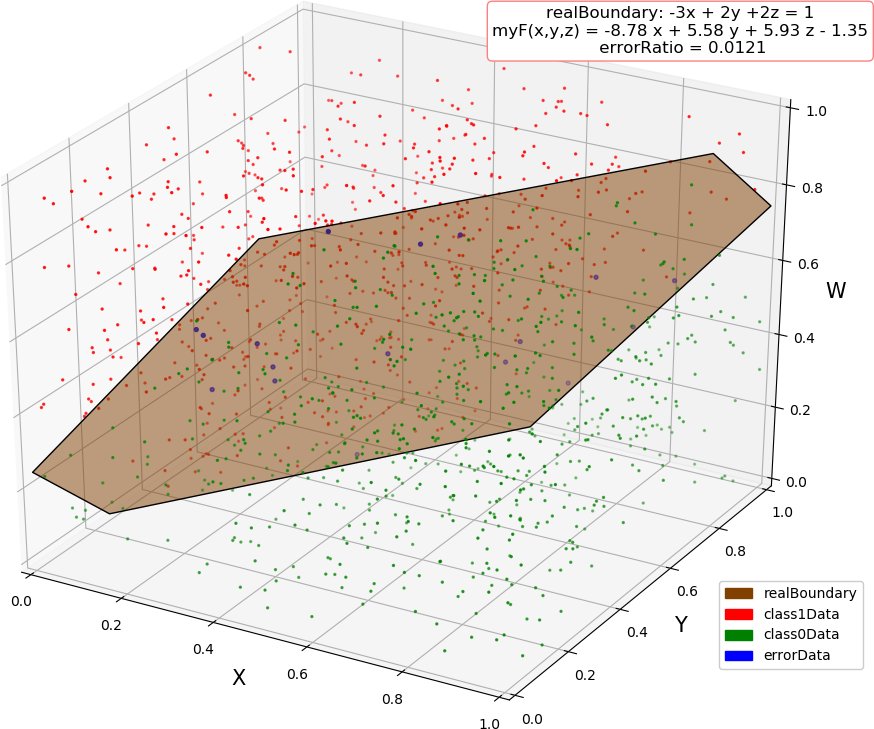
● 输出结果,一维 6 遍收敛,二维 39 遍,三维 87 遍,四维 89 遍
count =  1 , w =  [1.39770297 0.45      ] , error =  5.222155402906847
count =  2 , w =  [1.52702391 0.75      ] , error =  1.6525212964325524
count =  3 , w =  [1.99396967 0.75      ] , error =  3.8768795270185015
count =  4 , w =  [2.0734924 1.05     ] , error =  2.1108010510371176
count =  5 , w =  [2.08542138 1.05      ] , error =  0.2226526876961404
count =  6 , w =  [2.08542138 1.05      ] , error =  0.0
dim = 1, errorRatio = 0.0043
count =  1 , w =  [-0.86290479  1.73543324  0.45      ] , error =  10.072859142827403
count =  2 , w =  [-1.13927193  2.04084504  0.45      ] , error =  4.4609363561371165
count =  3 , w =  [-1.15553275  2.73079122  0.75      ] , error =  7.930218436293679

...

count =  37 , w =  [-3.24442847  6.45406089  1.65      ] , error =  0.5427638905658313
count =  38 , w =  [-3.25333719  6.53959919  1.65      ] , error =  2.6670168284877542
count =  39 , w =  [-3.25333719  6.53959919  1.65      ] , error =  0.0
dim = 2, errorRatio = 0.0
count =  1 , w =  [-1.83648172  1.13115561  1.48731853  0.15      ] , error =  15.299397796880317
count =  2 , w =  [-2.21432213  1.4718464   1.61271137  0.45      ] , error =  5.514265592439243
count =  3 , w =  [-2.65894841  1.73243095  1.7833203   0.45      ] , error =  5.782491180281051

...

count =  84 , w =  [-8.76231537  5.53262355  5.91015865  1.35      ] , error =  2.3909384841900865
count =  85 , w =  [-8.80616091  5.60771114  5.82973106  1.35      ] , error =  1.9246305102403725
count =  86 , w =  [-8.77906986  5.58426138  5.92865995  1.35      ] , error =  0.4663079739497135
count =  87 , w =  [-8.77906986  5.58426138  5.92865995  1.35      ] , error =  0.0
dim = 3, errorRatio = 0.0121
count =  1 , w =  [-2.55073743  0.77544673  0.79572989  1.11402485  0.15      ] , error =  21.2911454497099
count =  2 , w =  [-3.17104932  1.33820515  1.13266849  1.11805123  0.15      ] , error =  11.542535217905032
count =  3 , w =  [-3.56132108  1.37329683  1.34578486  1.58997522  0.45      ] , error =  9.590714392019622

...

count =  87 , w =  [-10.13469991   4.36826988   4.06767039   4.25598478   0.75      ] , error =  1.9723755293196636
count =  88 , w =  [-10.27022167   4.12906605   4.11467555   4.10943389   1.05      ] , error =  1.5046863818100382
count =  89 , w =  [-10.27022167   4.12906605   4.11467555   4.10943389   1.05      ] , error =  0.0
dim = 4, errorRatio = 0.0014
● 画图