MPAndroidChart使用也可以看我前几篇文章
1.横向双值柱状图
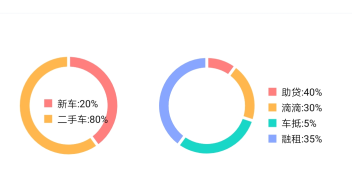
直接看图:
具体怎么时使用MPAndroidChart可已看代码
直接上代码:
初始化
 pieChart.setNoDataText("暂无数据");
        pieChart.setUsePercentValues(true);
        pieChart.getDescription().setEnabled(false);
        pieChart.setDragDecelerationFrictionCoef(0.95f);
        pieChart.setExtraOffsets(5, 10, 5, 5);
//        pieChart.setExtraBottomOffset(10);
//        pieChart.setExtraOffsets(0, 0, 0, 0);
//        holder.pieChart.setCenterText("ABC");
        pieChart.setDrawEntryLabels(false);

        pieChart.setDrawHoleEnabled(true);
        pieChart.setHoleColor(Color.WHITE);
        pieChart.setDrawCenterText(false);//饼状图中间可以添加文字

        pieChart.setHoleRadius(80f);
        pieChart.setTransparentCircleRadius(0f);
        pieChart.setRotationAngle(0);
        pieChart.animateY(1400, Easing.EaseInOutQuad);

        Legend l =  pieChart.getLegend();
        l.setVerticalAlignment(Legend.LegendVerticalAlignment.BOTTOM);
        if(type==1) {
            l.setHorizontalAlignment(Legend.LegendHorizontalAlignment.CENTER);
        }else{
            l.setHorizontalAlignment(Legend.LegendHorizontalAlignment.CENTER);
        }
        l.setOrientation(Legend.LegendOrientation.VERTICAL);
        l.setDrawInside(false);
        l.setXEntrySpace(5f);
        l.setYEntrySpace(0f);
        l.setYOffset(10f);

        // entry label styling
        pieChart.setEntryLabelColor(Color.WHITE);
//        holder.pieChart.setEntryLabelTypeface(tfRegular);
        pieChart.setEntryLabelTextSize(12f);
绑定数据
 ArrayList<PieEntry> entries = new ArrayList<>();
        PieDataSet dataSet = new PieDataSet(entries, "");
        dataSet.setSliceSpace(3f);

        ArrayList<Integer> colors = new ArrayList<>();

        for (int i = 0; i < values.size(); i++) {
            entries.add(new PieEntry((float)values.get(i),datas.get(i)));
            colors.add(resources.getColor(Constants.COLORS_ARRAY[i]));
        }

        dataSet.setColors(colors);
        dataSet.setValueTextColor(Color.TRANSPARENT);

        PieData pieData = new PieData(dataSet);
        pieData.setValueFormatter(new PercentFormatter(new DecimalFormat()));
        pieChart.setData(pieData);
        pieChart.notifyDataSetChanged();
        pieChart.invalidate();
关于MPAndroidChart使用可以看我前几篇关于横向双值柱状图文章
如果对你有帮助可以关注一下方便查看,欢迎关注讨论
1.横向双值柱状图