申明: 这里比较坑爹,大家写的时候要小心,这里和springboot的版本有关系哈,我使用的是2.0 版本,要么调频为1.5 版本,要么使用其他方式 解决错误,我选择了还是用2.0 各位慎重参考哈!
Hystrix-dashboard是一款针对Hystrix进行实时监控的工具,通过Hystrix Dashboard我们可以在直观地看到各Hystrix Command的请求响应时间, 请求成功率等数据
话不多说看项目,为了避免在一个项目上反复修改,大家看的一头雾水,所以我还是选择重新创建项目
1.创建项目

2. 选择项目类型
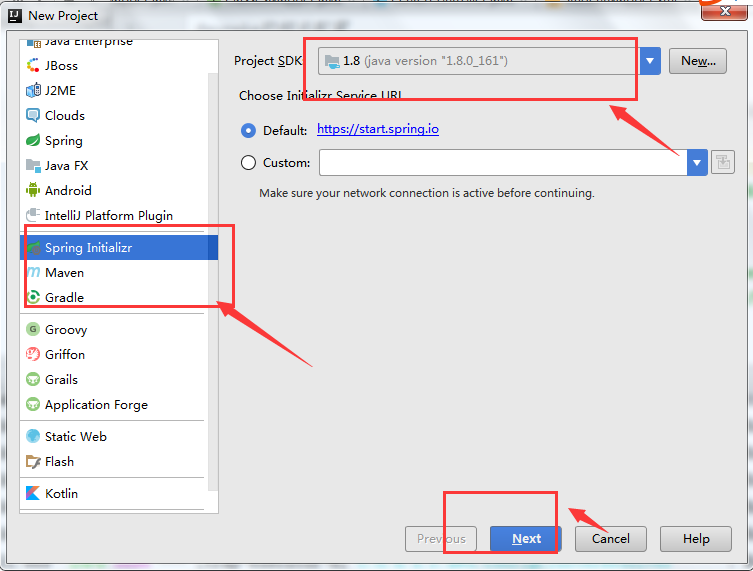
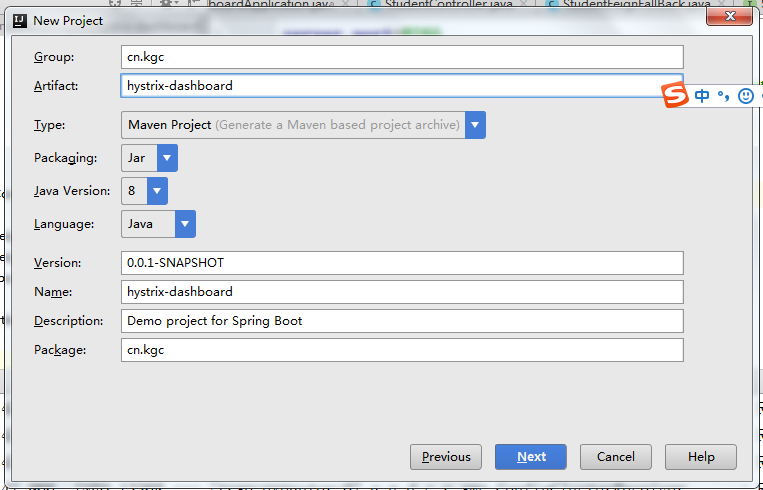
3.选择项目名称,可以随便写,但是不能有大写
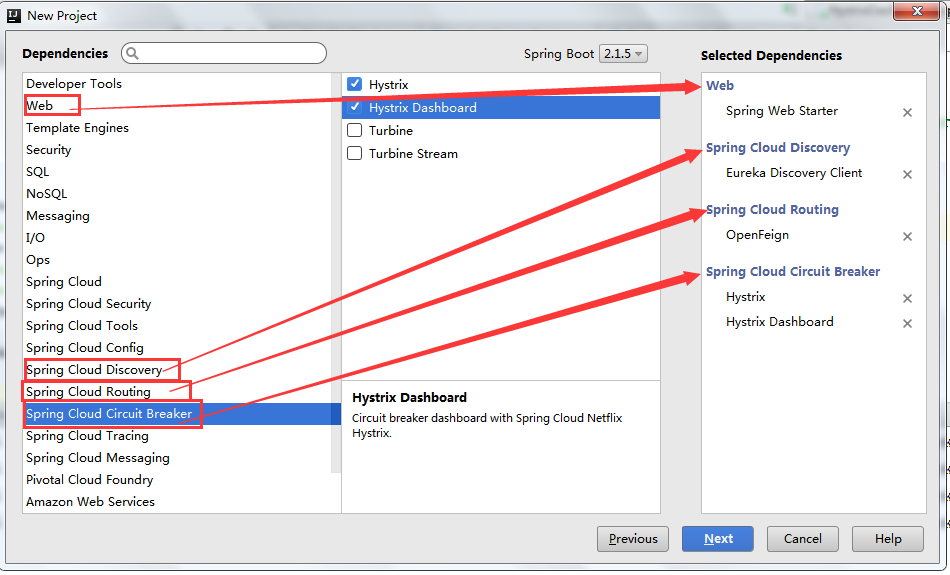
4.选择我们要生成的依赖
5.选择工程和模块命名

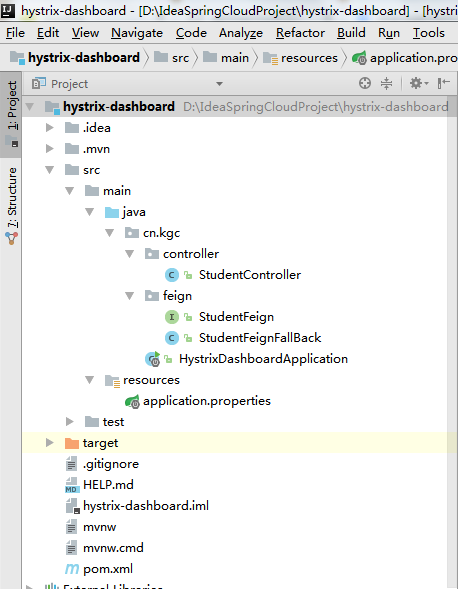
6.项目结构如下,和上一个木有大的变化,只是配置变了
7. 编辑pom.xml文件
<dependencies>
        <dependency>
            <groupId>cn.kgc</groupId>
            <artifactId>eureka-common-school</artifactId>
            <version>1.0-SNAPSHOT</version>
        </dependency>
        <!--@EnableDiscoveryClient-->
        <dependency>
            <groupId>org.springframework.cloud</groupId>
            <artifactId>spring-cloud-starter-netflix-eureka-client</artifactId>
        </dependency>
        <dependency>
            <groupId>org.springframework.cloud</groupId>
            <artifactId>spring-cloud-starter-netflix-hystrix</artifactId>
        </dependency>
        <!--@EnableHystrixDashboard-->
        <dependency>
            <groupId>org.springframework.cloud</groupId>
            <artifactId>spring-cloud-starter-netflix-hystrix-dashboard</artifactId>
        </dependency>
        <!--@EnableCircuitBreaker-->
        <dependency>
            <groupId>org.springframework.boot</groupId>
            <artifactId>spring-boot-starter-actuator</artifactId>
        </dependency>
        <!--@EnableFeignClients-->
        <dependency>
            <groupId>org.springframework.cloud</groupId>
            <artifactId>spring-cloud-starter-openfeign</artifactId>
        </dependency>

        <dependency>
            <groupId>org.springframework.boot</groupId>
            <artifactId>spring-boot-starter-test</artifactId>
            <scope>test</scope>
        </dependency>
    </dependencies>
8.编辑我们的属性文件
server.port=8765
spring.application.name=hystrix-dashboard
eureka.client.serviceUrl.defaultZone=http://localhost:8761/eureka/
# 将feign集成的断路器设置成有效状态
feign.hystrix.enabled=true
# 加载所有的端点
management.endpoints.web.exposure.include="*"
9..在cn.kgc.feign包下编写StudentFeign业务接口,好多人在这里添加service注解,木有看懂,但是我这里也能拿到数据
package cn.kgc.feign;
import org.springframework.cloud.openfeign.FeignClient;
import org.springframework.web.bind.annotation.RequestMapping;

/*FeignClient的name属性值和eureka_client_product的appliaction属性文件找那个的spring.application.name保持一致
fallback属性指定容错处理类
springcloud默认已经为feign整合了hystrix,只要hystrix在项目中,使用feign就会
默认使用熔断器处理所欲的请求
熔断器模式类似于生活中的电路保险丝,当电流抄在可能银帆危险时就会自动断开,使用熔断器模式,
如果请求出现异常,所有的请求都会直接返回而不会等待或阻塞,这样可以减少资源的浪费。
熔断器还有一种半开的状态,当熔断器发现异常后悔进入半打开状态,此时会定时接受
一个请求来检测系统是否恢复,如果请求调用成功,代表系统已经恢复正常,救护关掉熔断器,
否则继续打开*/
@FeignClient(name="client-school-provider",fallback = StudentFeignFallBack.class)
public interface StudentFeign {
    //下面的调用接口标准要和eureka-client-provider中的controller请求方法必须保持一致
    @RequestMapping("/data.do")
    public String stuData();


}
10..在cn.kgc.feign包下编写StudentFeignFallBack容错处理类
package cn.kgc.feign;

import org.springframework.stereotype.Component;

//容错处理类
@Component
public class StudentFeignFallBack implements StudentFeign{
    @Override
    public String stuData() {
        return "服务器异常,请稍后在尝试登陆";
    }
}
11.在cn.kgc.controller包下编写StudentController控制器类
package cn.kgc.controller;

import cn.kgc.feign.StudentFeign;
import org.springframework.beans.factory.annotation.Autowired;
import org.springframework.web.bind.annotation.RequestMapping;
import org.springframework.web.bind.annotation.RestController;

@RestController
public class StudentController {
    @Autowired
    private StudentFeign studentFeign;

    @RequestMapping("/studata.do")
    public String showOptionsData(){
        return studentFeign.stuData();
    }
}
12.启动拉。还是老规矩依次启动:eureka-server、eureka-client-provider、hystrix-dashboard
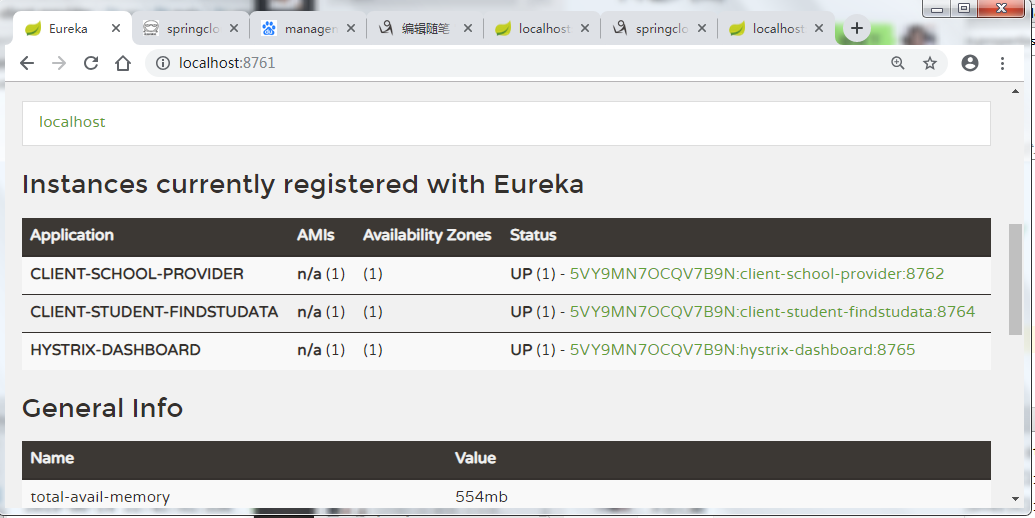
13. 正常访问
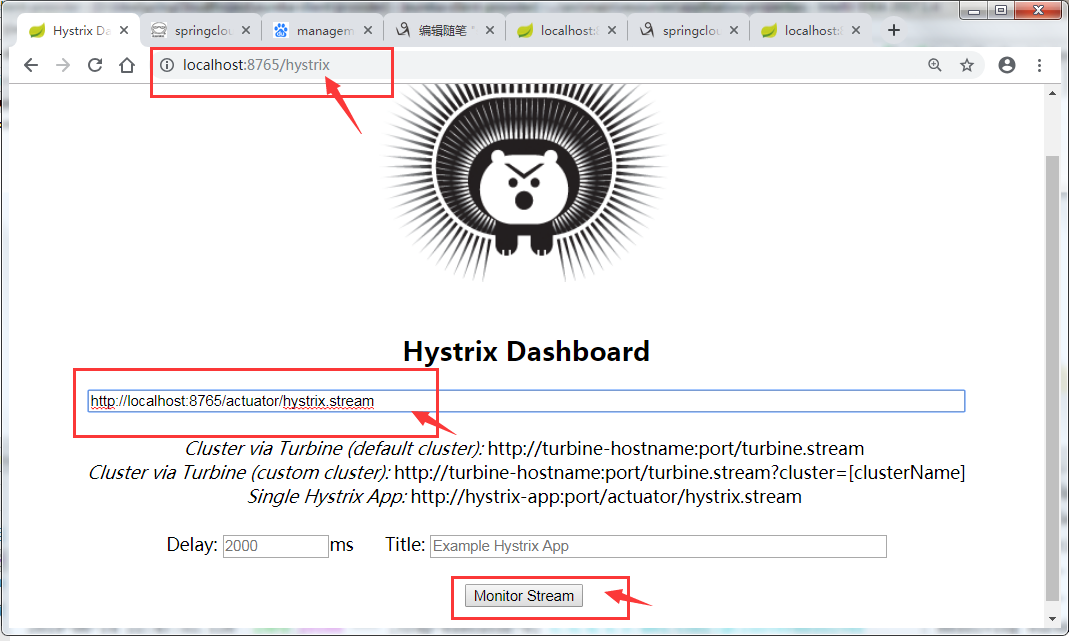
图中会有一些提示:
Cluster via Turbine (default cluster): http://turbine-hostname:port/turbine.stream
Cluster via Turbine (custom cluster): http://turbine-hostname:port/turbine.stream?cluster=[clusterName]
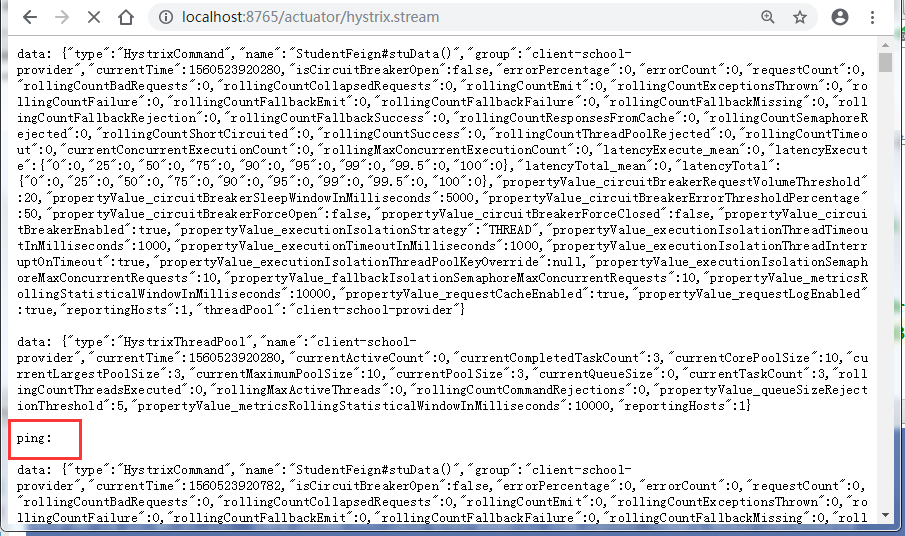
Single Hystrix App: http://hystrix-app:port/actuator/hystrix.stream
大概意思就是如果查看默认集群使用第一个url,查看指定集群使用第二个url,单个应用的监控使用最后一个,我们暂时只演示单个应用的所以在输入框中输入: http://localhost:8765/actuator/hystrix.stream ,输入之后点击 monitor,进入页面。如果没有请求会先显示Loading ...,
访问http://localhost:8765/actuator/hystrix.stream 也会不断的显示ping。
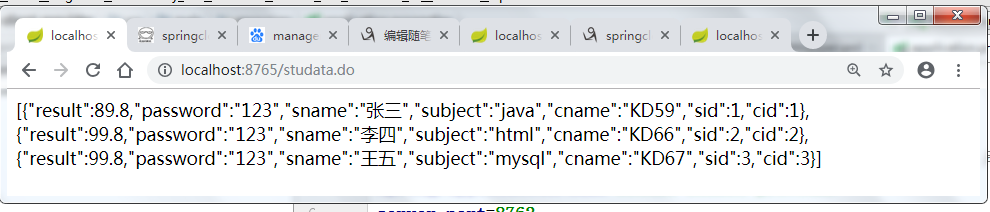
请求服务hhttp://localhost:8765/studata.do,

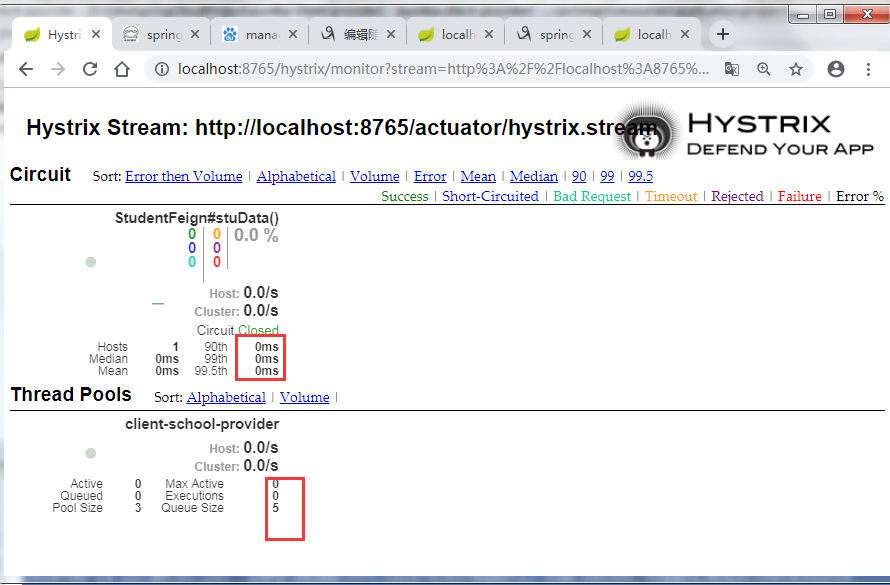
在刷新地址

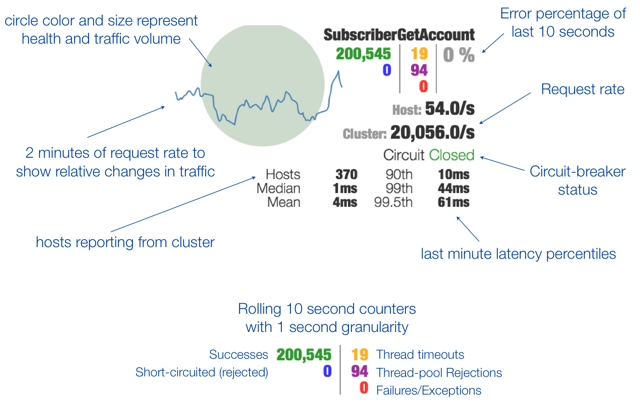
注意这些是啥意思,自己翻译下面的图,这个是把上面个列表以图形化的形式展示出来了,需要使用工具哦
断头了,为了发帖子,脖子要折了,转帖请注明出处
有问题请联系我哈:微信、QQ:964918306
此帖子为原创
作者:红酒人生
转载请注明出处:https://www.cnblogs.com/holly8/p/11025732.html