版权声明:技术是共享的,如有借鉴以及转载侵权之处,请告知,会第一时间删除 https://blog.csdn.net/qq_22917163/article/details/91579717
前言
在实际工作中,我们有许多内部服务如zabbix、zentao、wiki、jumpserver等数据库都要用到mysql服务,把所有库建在一个实例下有点不合适,放到不同的服务器上又太浪费服务器资源,这些服务对mysql性能要求不大,所以我们可以采用在一台服务器上部署多个mysql实例的方式来满足我们的需求,又充分利用了这一台服务器的硬件资源。随之而来的就是对这些mysql实例的必要监控,下边就来介绍一下如何用zabbix来实现对同一台服务器上多个mysql实例的监控。
1 .编写相关脚本
1.1 存放mysql多实例监听端口的文件
[admin@oneecar-qa017 ~]$ cat /etc/zabbix/scripts/mysql_multiple/mysql_port.txt
3304
3305
3306
3307
3308
3309
其中存放的是各个实例监听的端口号
1.2 端口自动发现脚本
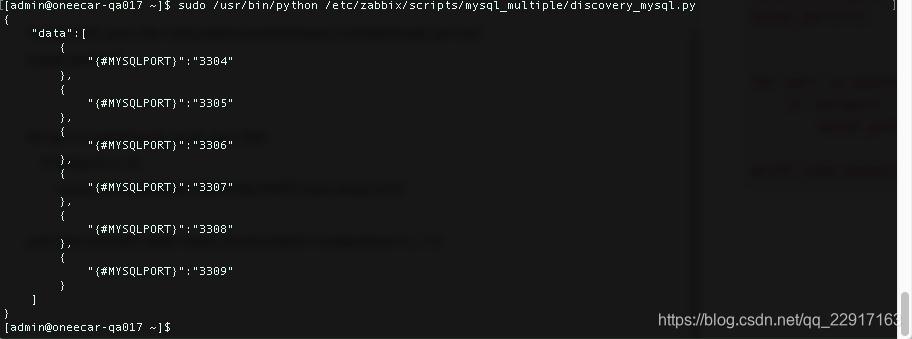
[admin@oneecar-qa017 ~]$ cat /etc/zabbix/scripts/mysql_multiple/discovery_mysql.py
#/usr/bin/python
import json
import os
import subprocess

mysql_multi_port_file='/etc/zabbix/scripts/mysql_multiple/mysql_port.txt'
mysql_ports=[]


for port in open(mysql_multi_port_file):
	if len(port) != 0:
		mysql_ports.append({'{#MYSQLPORT}':port.strip('\n')})

print json.dumps({'data':mysql_ports},indent=4,separators=(',',':'))
脚本执行结果如下图
1.3 监控项脚本
cat /etc/zabbix/scripts/mysql_multiple/check_Multimysql.sh
#!/bin/bash

MYSQL_USER='zabbix'
MYSQL_PWD='123456'
MYSQL_HOST='127.0.0.1'
MYSQL_PORT=$2
MYSQL_CONN="/usr/local/mysql/bin/mysqladmin -u${MYSQL_USER} -p${MYSQL_PWD} -h${MYSQL_HOST} --port=${MYSQL_PORT}"

help() {
	echo "Usage:$0  [ping|Uptime|Com_update|Slow_queries|Com_select|Com_rollback|Questions|Com_insert|Com_delete|Com_commit|Bytes_sent|Bytes_received|Com_begin]  port"
}

if [ $# -lt "2" ];then
	echo "....!"
	help
	exit 2
fi

case $1 in
	ping)
		result=`${MYSQL_CONN} ping 2>/dev/null | grep -c alive`
		echo $result
		;;
	Uptime)
		result=`${MYSQL_CONN} status 2>/dev/null | cut -f2 -d":"|cut -f1 -d"T"`
		echo $result
		;;
	Com_update)
		result=`${MYSQL_CONN} extended-status 2>/dev/null | grep -w "Com_update"|cut -d"|" -f3`
		echo $result
		;;
	Slow_queries)
		result=`${MYSQL_CONN} status 2>/dev/null | cut -f5 -d":"|cut -f1 -d"O"`
		echo $result
		;;
	Com_select)
		result=`${MYSQL_CONN} extended-status 2>/dev/null | grep -w "Com_select"|cut -d"|" -f3`
		echo $result
		;;
	Com_rollback)
		result=`${MYSQL_CONN} extended-status 2>/dev/null | grep -w "Com_rollback"|cut -d"|" -f3`
		echo $result
		;;
	Questions)
		result=`${MYSQL_CONN} status 2>/dev/null | cut -f4 -d":"|cut -f1 -d"S"`
		echo $result
		;;
	Com_insert)
		result=`${MYSQL_CONN} extended-status 2>/dev/null | grep -w "Com_insert"|cut -d"|" -f3`
		echo $result
		;;
	Com_delete)
		result=`${MYSQL_CONN} extended-status 2>/dev/null | grep -w "Com_delete"|cut -d"|" -f3`
		echo $result
		;;
	Com_commit)
		result=`${MYSQL_CONN} extended-status 2>/dev/null | grep -w "Com_commit"|cut -d"|" -f3`
		echo $result
		;;
	Bytes_sent)
		result=`${MYSQL_CONN} extended-status 2>/dev/null | grep -w "Bytes_sent"|cut -d"|" -f3`
		echo $result
		;;
	Bytes_received)
		result=`${MYSQL_CONN} extended-status 2>/dev/null | grep -w "Bytes_received" |cut -d"|" -f3`
		echo $result
		;;
	Com_begin)
		result=`${MYSQL_CONN} extended-status 2>/dev/null | grep -w "Com_begin"|cut -d"|" -f3`
		echo $result
		;;
     *)
		help
		;;
esac
2.zabbix配置
2.1 zabbix客户端配置
编写cat /etc/zabbix/zabbix_agentd.d/userparameter_mysql_multi.conf
UserParameter=mysql_discovery[*],/usr/bin/python /etc/zabbix/scripts/mysql_multiple/discovery_mysql.py
UserParameter=mysql_status[*],/bin/bash /etc/zabbix/scripts/mysql_multiple/check_Multimysql.sh $1 $2
UserParameter=mysql.ping[*],/bin/bash /etc/zabbix/scripts/mysql_multiple/check_Multimysql.sh ping $1
2.2 zabbix服务端配置
2.2.1 创建监控模板
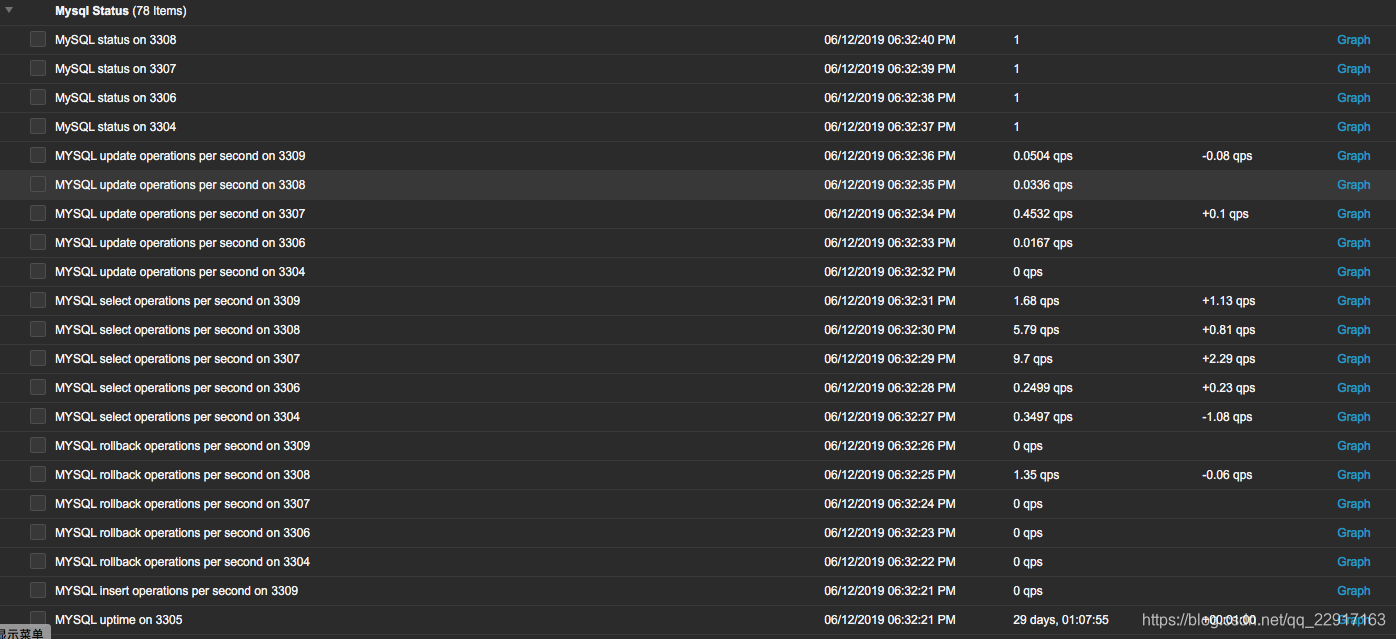
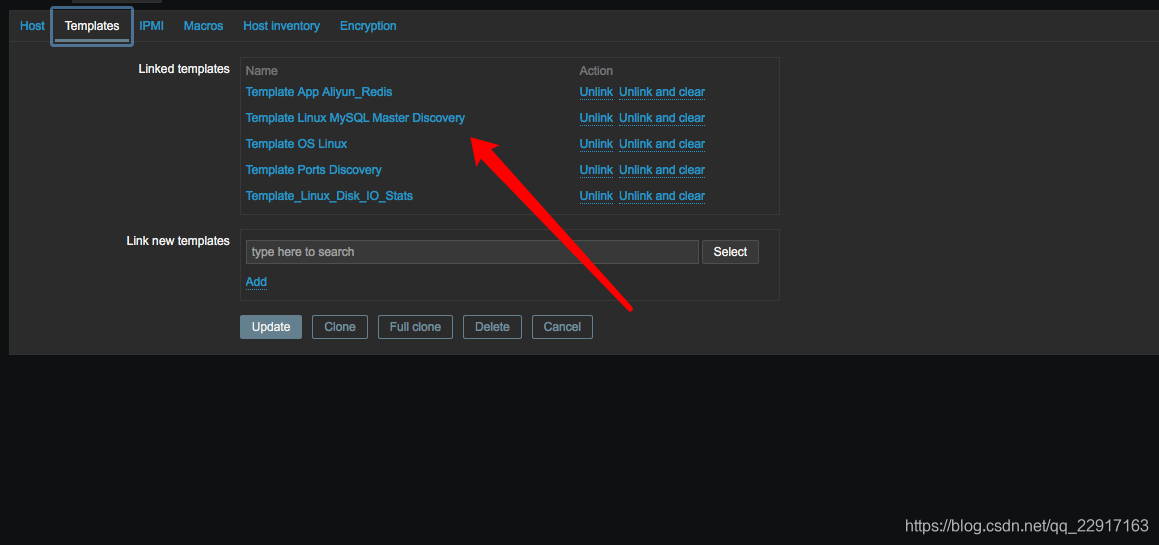
2.2.2 将模板连接到要监控的服务器上
然后稍等一会儿,查看最新监控数据,就可以看到最新的监控信息了