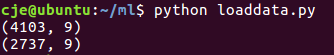
数据的导入和内存管理
1.数据表文件的读取
由于现在大多数系统内存都在几个G,因此小点的数据表处理比较简单,可以直接读入内存并结构化
下面例子是用python读取数据表文件,并将其存到矩阵中,并输出矩阵的行、列数
- # -*- coding: utf-8 -*-
- import sys
- import os
- from numpy import *
- # 配置utf-8输出环境
- reload(sys)
- sys.setdefaultencoding('utf-8')
- #数据文件转矩阵
- # path: 数据文件路径
- # delimiter: 文件分隔符
- def file2matrix(path,delimiter):
- recordlist = []
- fp = open(path,"rb") # 读取文件内容
- content = fp.read()
- fp.close()
- rowlist = content.splitlines() # 按行转换为一维表
- # 逐行遍历
- # 结果按分隔符分割为行向量
- recordlist =[ row.split(delimiter) for row in rowlist if row.strip()]
- return mat(recordlist) # 返回转换后的矩阵形式
- root = "testdata" #数据文件所在路径
- pathlist = os.listdir(root) # 获取路径下所有数据文件
- for path in pathlist:
- recordmat = file2matrix(root+"/"+path,"\t") # 文件到矩阵的转换
- print shape(recordmat) # 输出解析后矩阵的行、列数
输出结果如下
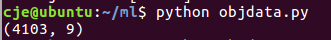
2.对象的持久化
有时候我们希望数据以对象的方式保存,python的ePicke模块支持对象的读写
下面例子将转换为矩阵的数据持久化为对象的文件,并读取序列化后的文件
- # -*- coding: utf-8 -*-
- import sys
- import os
- from numpy import * #导入序列化库
- import cPickle as pickle
- # 配置utf-8输出环境
- reload(sys)
- sys.setdefaultencoding('utf-8')
- #数据文件转矩阵
- # path: 数据文件路径
- # delimiter: 文件分隔符
- def file2matrix(path,delimiter):
- recordlist = []
- fp = open(path,"rb") # 读取文件内容
- content = fp.read()
- fp.close()
- rowlist = content.splitlines() # 按行转换为一维表
- # 逐行遍历
- # 结果按分隔符分割为行向量
- recordlist =[ row.split(delimiter) for row in rowlist if row.strip()]
- return mat(recordlist) # 返回转换后的矩阵形式
- root = "testdata" #数据文件所在路径
- pathlist = os.listdir(root) # 获取路径下所有数据文件
- recordmat = [file2matrix(root+"/"+path,"\t") for path in pathlist]
- # 转换为对象文件
- file_obj = open(root+"/recordmat.dat", "wb")
- pickle.dump(recordmat[0],file_obj) #将生成的矩阵独享保存到指定位置
- file_obj.close()
- # 读取序列化后的文件
- read_obj = open(root+"/recordmat.dat", "rb")
- readmat = pickle.load(read_obj) #从指定位置读取对象
- print shape(readmat)
输出结果如下
3.高效读取大文本文件
当遇到大文本文件时(几G,几十G,超过内存大小),可以使用如下函数逐行读取,逐行处理
如下例子读取了文件的前10行
- # -*- coding: utf-8 -*-
- import sys
- import os
- from numpy import *
- # 配置utf-8输出环境
- reload(sys)
- sys.setdefaultencoding('utf-8')
- # 按行读文件,读取指定行数
- # nmax=0按行读取全部
- def readfilelines(path,nmax=0):
- fp = open(path,"rb")
- ncount = 0 # 已读取行
- while True:
- content = fp.readline()
- # 判断是否到文件尾,是否读取到
- if content =="" or (ncount>=nmax and nmax!=0):
- break
- yield content # 返回读取的行
- if nmax != 0 : ncount += 1
- fp.close()
- path = "testdata/01.txt" #数据文件所在路径
- # 读取10行,
- for line in readfilelines(path,nmax=10):
- print line.strip()
输出结果如下
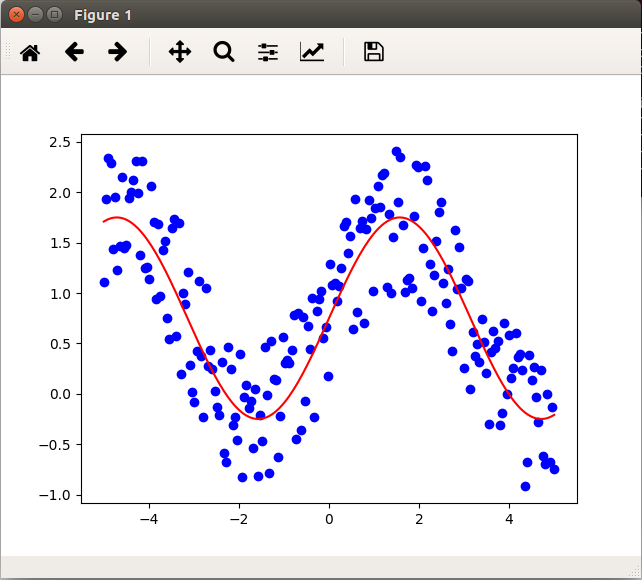
表与线性结构的可视化
- # -*- coding: utf-8 -*-
- import numpy as np
- import matplotlib.pyplot as plt
- # 曲线数据加入噪声
- x = np.linspace(-5,5,200);
- y = np.sin(x);# 给出y与x的基本关系
- yn = y+np.random.rand(1,len(y))*1.5 ; # 加入噪声的点集
- # 绘图
- fig = plt.figure()
- ax = fig.add_subplot(111)
- ax.scatter(x,yn,c='blue',marker='o')
- ax.plot(x,y+0.75,'r')
- plt.show()
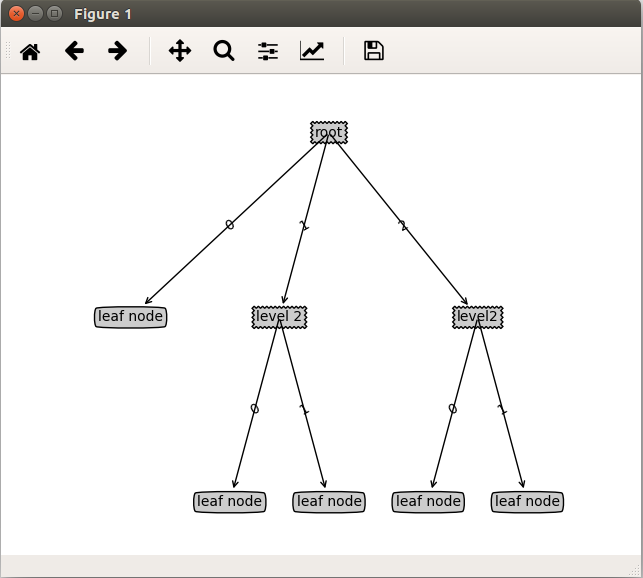
树与分类结构的可视化
因为MatPlotlib没有提供专门绘制树的API,所以这里用了treePlotter
- # -*- coding: utf-8 -*-
- import numpy as np
- import matplotlib.pyplot as plt
- import treePlotter as tp
- # 绘制树
- myTree = {'root': {0: 'leaf node', 1: {'level 2': {0: 'leaf node', 1: 'leaf node'}},2:{'level2': {0: 'leaf node', 1: 'leaf node'}}}}
- tp.createPlot(myTree)
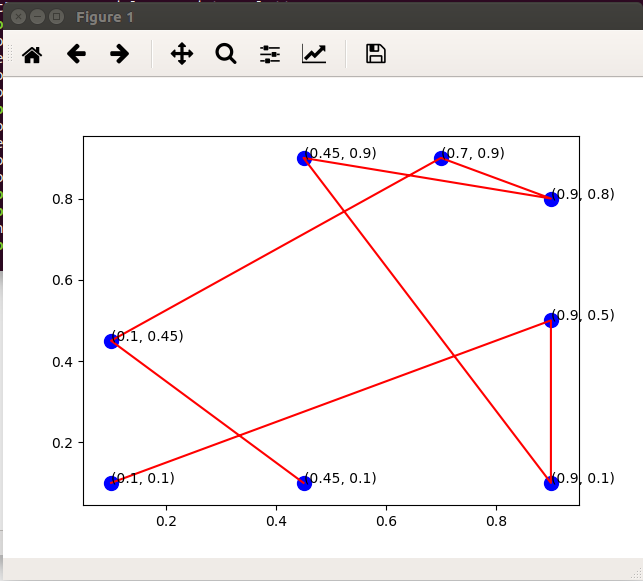
图与网络结构的可视化
图和网络结构是神经网络和贝叶斯网络中重要的数据结构,完整的结构一般使用dict加list进行存储。
- Node = {'node name':node_info}
- Arc = {'arc name':list[node1,node2,…]}
在算法中,经常简化存储为邻接矩阵的形式,使用NumPy的矩阵结构存储点坐标;弧的坐标使用距离公式计算。可视化时可以生成x轴的list和y轴的list显示在图片中。
- # -*- coding: utf-8 -*-
- import numpy as np
- from numpy import *
- import matplotlib.pyplot as plt
- # nodelist = ["city1","city2","city3","city4","city5","city6","city7","city8"]
- dist = mat([[0.1,0.1],[0.9,0.5],[0.9,0.1],[0.45,0.9],[0.9,0.8],[0.7,0.9],[0.1,0.45],[0.45,0.1]])
- m,n = shape(dist)
- # 绘图
- fig = plt.figure()
- ax = fig.add_subplot(111)
- ax.scatter(dist.T[0],dist.T[1],c='blue',marker='o',s=100)
- for point in dist.tolist():
- plt.annotate("("+str(point[0])+", "+str(point[1])+")",xy = (point[0],point[1]))
- xlist = []
- ylist = []
- for px,py in zip(dist.T.tolist()[0],dist.T.tolist()[1]):
- xlist.append([px])
- ylist.append([py])
- # print xlist
- # print ylist
- ax.plot(xlist,ylist,'r')
- plt.show()