机器学习三剑客:numpy、pandas、matplotlib
NumPy系统是Python的一种开源的数值计算扩展。这种工具可用来存储和处理大型矩阵。
pandas 是基于NumPy 的一种工具,该工具是为了解决数据分析任务而创建的。
Matplotlib 是一个 Python 的 2D绘图库,它以各种硬拷贝格式和跨平台的交互式环境生成出版质量级别的图形。
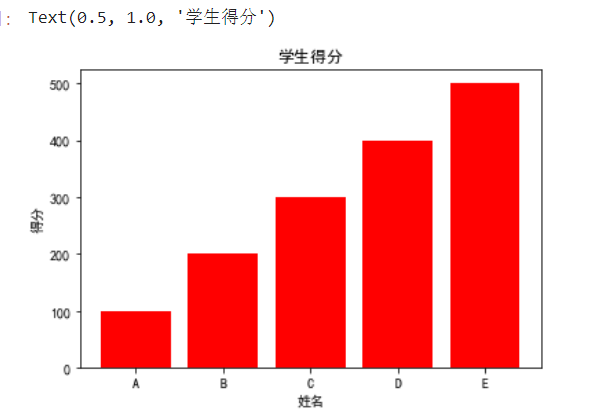
柱状图bar
from matplotlib import pyplot as plt
import matplotlib
 # 显示图表,仅限于jupyter使用
%matplotlib inline
#指定默认字体
matplotlib.rcParams['font.sans-serif'] = ['SimHei']
# 第一个参数:索引
# 第二个参数:高度    参数必须对应否则报错
plt.bar(range(5),[100,200,300,400,500],color='red')
plt.xticks(range(5),['A','B','C','D','E'])
plt.xlabel('姓名')
plt.ylabel('得分')
plt.title('学生得分')
# 或显示图标Plt.show()
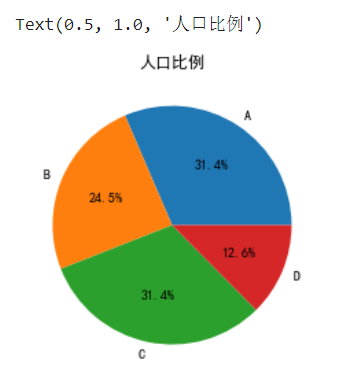
饼图pie
labels = ['A','B','C','D']
# autopct='%1.1f%%'显示比列,格式化显示一位小数,固定写法
plt.pie([50,39,50,20],labels=labels,autopct='%1.1f%%')
plt.title('人口比例')
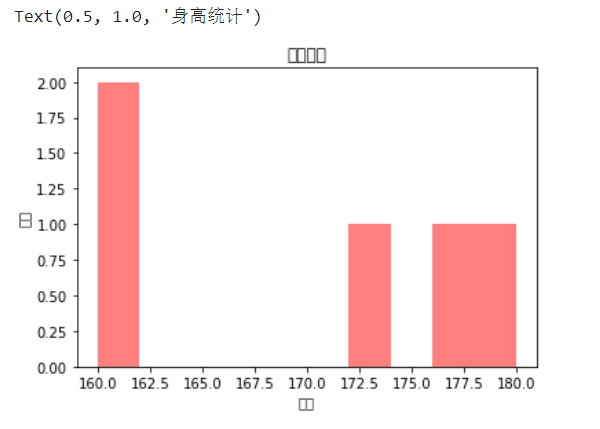
直方图hist
from matplotlib import pyplot as plt
import matplotlib

heights = [180,160,172,177,160]
plt.hist(heights,color='red',alpha=0.5)
# 横轴heights,纵轴当前值的个数
plt.xlabel('身高')
plt.ylabel('人数')
plt.title('身高统计')
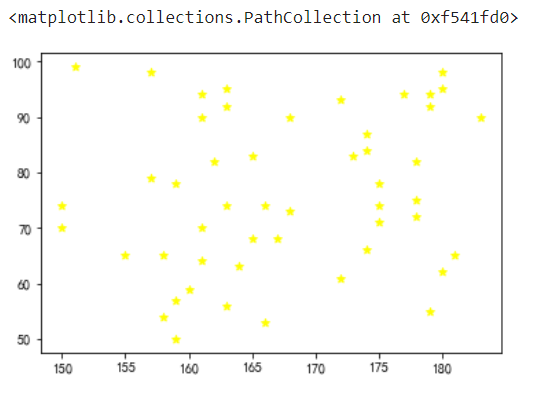
散点图scatter
# 5、绘制一个散点图
# 用random模块获取两组数据,分别代表横纵坐标。一组数据里有50个数,
# 用随机种子的方法固定住random模块获取得到的数据
# 并将散点图里的符号变为'*'
import numpy as np
np.random.seed(10)  # 随机种子,将随机数固定住
heights = []
weights = []
heights.append(np.random.randint(150,185,size=50))
# weights.append(np.random.normal(loc=50,scale=100,size))  # 生成正太分布,也称高斯分布
weights.append(np.random.randint(50,100,size=50))
plt.scatter(heights,weights,marker='*',color='yellow')   #默认是圆点,marker='*'
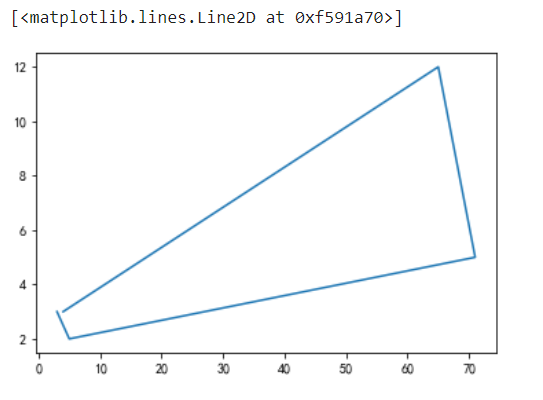
折线图plot
x = [4,65,71,5,3]
y = [3,12,5,2,3]
plt.plot(x,y)
# plt.savefig('a.jpg') # 保存图片