版权声明:本文为博主原创文章,未经博主允许不得转载。 https://blog.csdn.net/seamanj/article/details/84981594
不管怎样, 逗号分开的是维度, 所以数据的排列只考虑一维即可, 其他照搬
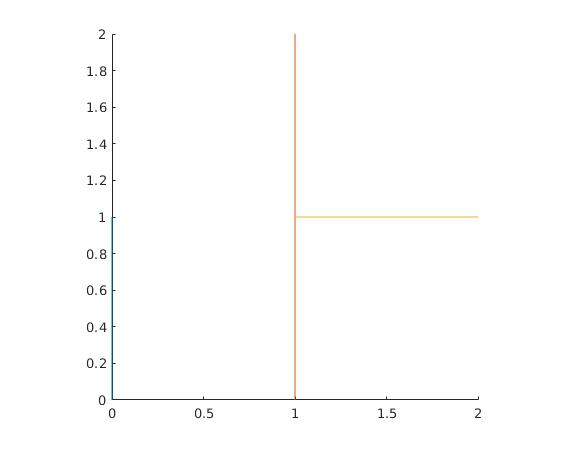
对于数据
先竖着每 维画线段, 然后 下一个column作 为新的线段 , 所以线段 为
到
到
到
A= [0 0 ;
    1 0 ;
    1 1 ];
B = [0 1 ;
    1 2;
    2 1 ];

hold on;
% plot([A(1,1) B(1,1)] , [ A(1,2) B(1,2) ] );
% plot([A(2,1) B(2,1)] , [ A(2,2) B(2,2) ] );
% plot([A(3,1) B(3,1)] , [ A(3,2) B(3,2) ] );

plot([A(:,1) B(:,1)]', [A(:,2) B(:,2)]');

% camproj('perspective');
 axis square;
% axis off;
% hold on;
如果是这样的数据
那么 就是线段
到
到
到
到
A= [0 0 ;
    1 0 ;
    1 1 ];
B = [0 1 ;
    1 2;
    2 1 ];

hold on;
% plot([A(1,1) B(1,1)] , [ A(1,2) B(1,2) ] );
% plot([A(2,1) B(2,1)] , [ A(2,2) B(2,2) ] );
% plot([A(3,1) B(3,1)] , [ A(3,2) B(3,2) ] );

plot([A(:,1) B(:,1)], [A(:,2) B(:,2)]);

% camproj('perspective');
 axis square;
% axis off;
% hold on;
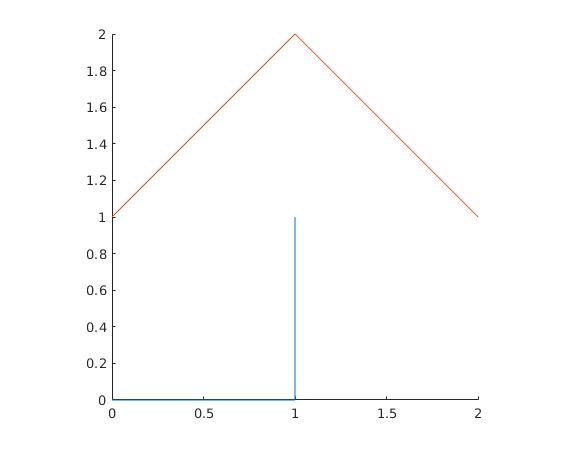
可以看到是四条线段