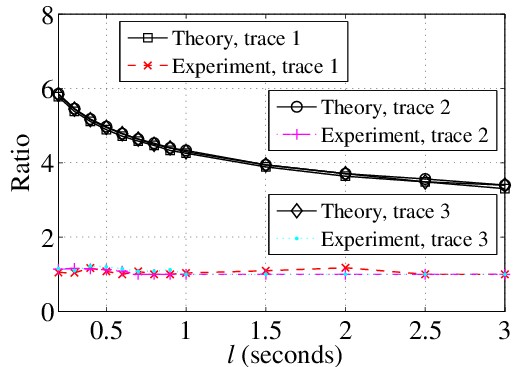
用matlab 画图时,发现线太多,生成的图例,遮盖了曲线。于是想画成多个图例,然后可以自由拖动。
废话不多说,2)代码(设置多个图例的部分在最后20行); 1)效果。
% ----- 1
效果:
% ----- 2 关键部分代码:
% ===== Figure format :
figure
TextFontSize=20;
LegendFontSize = 16;
set(0,'DefaultAxesFontName','Times',...
    'DefaultLineLineWidth',1,...
    'DefaultLineMarkerSize',8);
set(gca,'FontName','Times New Roman','FontSize',TextFontSize);
set(gcf,'Units','inches','Position',[0 0 6.0 4.0]);
% ===== Figure format :~

% ============================== Plot the Trace1 :
% --- 1
h11 = plot(X_items1, UB_ratio_Ana_GA1, '-sk');
hold on
% --- 2
h12 = plot(X_items1, Ratio_GA_over_OPT1, '--xr');
hold on
% === Plot the Trace1 :~

% ============================== Plot the Trace2 :
% --- 1
h21 = plot(X_items2, UB_ratio_Ana_GA2, '-ok');
hold on
% --- 2
h22 = plot(X_items2, Ratio_GA_over_OPT2, '-.+m');
hold on
% === Plot the Trace2 :~

% ============================== Plot the Trace3 :
% --- 1
h31 = plot(X_items3, UB_ratio_Ana_GA3, '-dk');
hold on
% --- 2
h32 = plot(X_items3, Ratio_GA_over_OPT3, ':.c');
hold on
% === Plot the Trace3 :~


grid on
axis([0.2 3.0 0 8])

xlabel('{\it l} (seconds)')
ylabel('Ratio')

% ============= Legend 1 :
hg1 = legend('Theory, trace 1', 'Experiment, trace 1', 0);
set(hg1,'FontSize',LegendFontSize);
% === Legend 1 :~

ah2 = axes('position',get(gca,'position'),'visible','off');

% ============= Legend 2 :
hg2 = legend(ah2, [h21 h22], 'Theory, trace 2', 'Experiment, trace 2', 0);
set(hg2,'FontSize',LegendFontSize);
% === Legend 2 :~

ah3 = axes('position',get(gca,'position'), 'visible','off');

% ============= Legend 3 :
hg3 = legend(ah3, [h31 h32], 'Theory, trace 3', 'Experiment, trace 3', 0);
set(hg3,'FontSize',LegendFontSize);
% === Legend 3 :~
Davy_H
2014-9-13