距离上一次打开Matlab已经过去了半年多,再次上手,画图时诸多不熟悉,促使我写下这篇blog,自己以后可以快速查看,也分享给大家~
二维线图 plot
plot(X1,Y1,LineSpec1,...,Xn,Yn,LineSpecn) 设置每个线条的线型、标记符号和颜色。
指定线型、颜色和标记
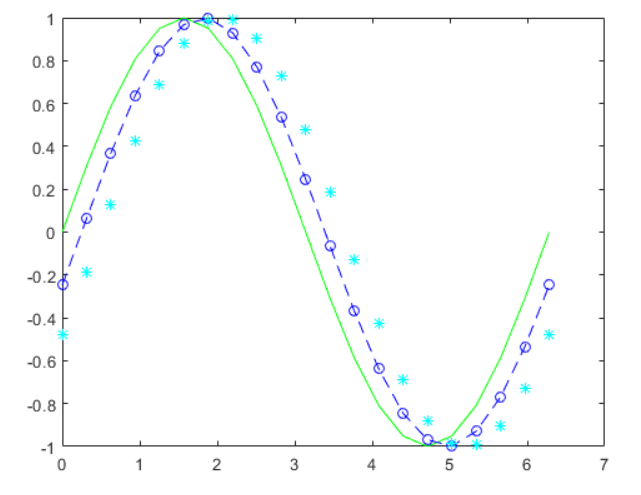
x = 0:pi/10:2*pi;
y1 = sin(x);
y2 = sin(x-0.25);
y3 = sin(x-0.5);

figure
plot(x,y1,'g',x,y2,'b--o',x,y3,'c*')
指定线宽、标记大小和标记颜色
x = -pi:pi/10:pi;
y = tan(sin(x)) - sin(tan(x));

figure
plot(x,y,'--gs',...
    'LineWidth',2,...
    'MarkerSize',10,...
    'MarkerEdgeColor','b',...
    'MarkerFaceColor',[0.5,0.5,0.5])

添加标题和轴标签
figure
plot(x,y,'Color',[0,0.7,0.9])

title('2-D Line Plot')
xlabel('x')
ylabel('cos(5x)')
axis([xmin xmax ymin ymax])
指定线图的坐标区
ax1 = subplot(2,1,1); % top subplot
x = linspace(0,3);
y1 = sin(5*x);
plot(ax1,x,y1)
title(ax1,'Top Subplot')
ylabel(ax1,'sin(5x)')

ax2 = subplot(2,1,2); % bottom subplot
y2 = sin(15*x);
plot(ax2,x,y2)
title(ax2,'Bottom Subplot')
ylabel(ax2,'sin(15x)')

LineSpec - 线型、标记和颜色
| 线型 | 说明 | 表示的线条 |
|---|---|---|
'-' |
实线 |
|
'--' |
虚线 |
|
':' |
点线 |
|
'-.' |
点划线 |
|
'none' |
无线条 | 无线条 |
| 标记 | 说明 |
|---|---|
o |
圆圈 |
+ |
加号 |
* |
星号 |
. |
点 |
x |
叉号 |
s |
方形 |
d |
菱形 |
^ |
上三角 |
v |
下三角 |
> |
右三角 |
< |
左三角 |
p |
五角形 |
h |
六角形 |
| 颜色 | 说明 |
|---|---|
|
|
黄色 |
|
|
品红色 |
|
|
青蓝色 |
|
|
红色 |
|
|
绿色 |
|
|
蓝色 |
|
|
白色 |
|
|
黑色 |
'Marker' - 标记符号
| 值 | 说明 |
|---|---|
'o' |
圆圈 |
'+' |
加号 |
'*' |
星号 |
'.' |
点 |
'x' |
叉号 |
'square' 或 's' |
方形 |
'diamond' 或 'd' |
菱形 |
'^' |
上三角 |
'v' |
下三角 |
'>' |
右三角 |
'<' |
左三角 |
'pentagram' 或 'p' |
五角星(五角形) |
'hexagram' 或 'h' |
六角星(六角形) |
'none' |
无标记 |
'MarkerEdgeColor' - 标记轮廓颜色
'MarkerFaceColor' - 标记填充颜色
'MarkerSize' - 标记大小
grid on/off 网格开关
box on/off 图象的右上角和左上角边界开关
figure('NumberTitle', 'off', 'Name', 'S Parameter (dB) - Cartesian') figure的名称
极坐标系 ploarplot
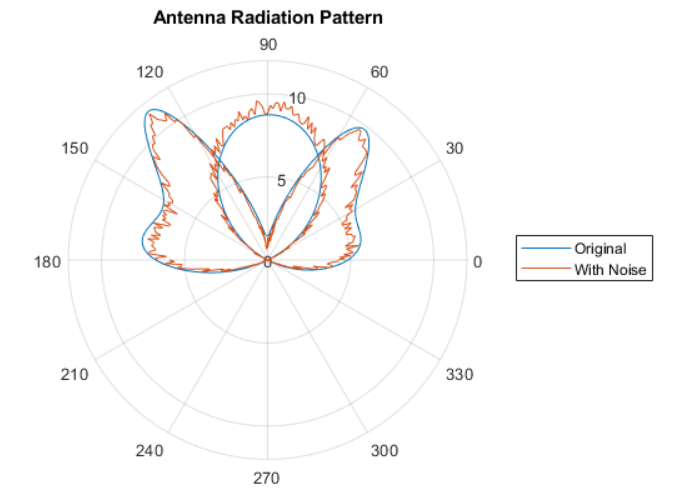
load(fullfile(matlabroot,'examples','matlab','antennaData.mat'))

figure
polarplot(theta,rho)

为极坐标图添加注释
legend('Original','With Noise')
title('Antenna Radiation Pattern')
更改极坐标区范围
rmin = min(rho);
rmax = max(rho);
rlim([rmin rmax]);
thetalim([0 180]);

创建极坐标直方图
polarhistogram(direction)
