版权声明:本文为Charles Dong原创文章,未经博主允许不得转载。([email protected]) https://blog.csdn.net/MrCharles/article/details/89694111
本文采用PCA+KNN的方法进行kaggle手写数字识别,训练数据共有42000行,每行代表一幅数字图片,共有784列(一副数字图像是28*28像素,将一副图像展开为一行即784),更多关于Digit Recognizer项目的介绍https://www.kaggle.com/c/digit-recognizer
由于训练数据量太大,直接采用KNN非常耗时,采用PCA降维的方法,选取25个维度,跑完全部数据只需200秒左右。
加载package
# This Python 3 environment comes with many helpful analytics libraries installed
# It is defined by the kaggle/python docker image: https://github.com/kaggle/docker-python
# For example, here's several helpful packages to load in

import numpy as np # linear algebra
import pandas as pd # data processing, CSV file I/O (e.g. pd.read_csv)
import matplotlib.pyplot as plt # import de Matplotlib
from IPython.display import display
from PIL import Image
# Input data files are available in the "../input/" directory.
# For example, running this (by clicking run or pressing Shift+Enter) will list the files in the input directory

import os
print(os.listdir("../input"))

# Any results you write to the current directory are saved as output.
read data
train=pd.read_csv('../input/train.csv')
train.shape

submission = pd.read_csv('../input/test.csv')

test=pd.read_csv('../input/test.csv')
test.shape

y_train = train['label']
y_train.head()

x_train=train.drop(['label'], axis=1)
x_train.head() # affiche le tableau ci-dessous

X_submission =test
PCA 降维探索
pca = PCA(200)
pca_full = pca.fit(x_train)

plt.plot(np.cumsum(pca_full.explained_variance_ratio_))
plt.xlabel('# of components')
plt.ylabel('Cumulative explained variance')

选择50维度, 拆分数据为训练集,测试机
pca = PCA(n_components=50)
X_train_transformed = pca.fit_transform(x_train)
X_submission_transformed = pca.transform(x_test)
from sklearn.model_selection import train_test_split

X_train_pca, X_test_pca, y_train_pca, y_test_pca = train_test_split(X_train_transformed, y_train, test_size=0.2, random_state=13)
KNN PCA降维和K值筛选
components = [5, 10, 15, 20, 25, 30, 35, 40, 45, 50]
neighbors = [1, 2, 3, 4, 5, 6, 7]

scores = np.zeros( (components[len(components)-1]+1, neighbors[len(neighbors)-1]+1 ) )
from sklearn.neighbors import KNeighborsClassifier

for component in components:
    for n in neighbors:
        knn = KNeighborsClassifier(n_neighbors=n)
        knn.fit(X_train_pca[:,:component], y_train_pca)
        score = knn.score(X_test_pca[:,:component], y_test_pca)
        #predict = knn.predict(X_test_pca[:,:component])
        scores[component][n] = score

        print('Components = ', component, ', neighbors = ', n,', Score = ', score)

k 值的意义:

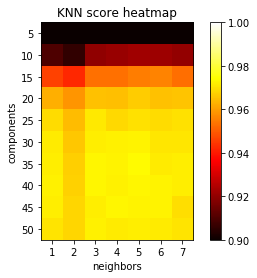
分析k & 维度 vs 精度
scores = np.reshape(scores[scores != 0], (len(components), len(neighbors)))

x = [0, 1, 2, 3, 4, 5, 6]
y = [0, 1, 2, 3, 4, 5, 6, 7, 8, 9]

plt.rcParams["axes.grid"] = False

fig, ax = plt.subplots()
plt.imshow(scores, cmap='hot', interpolation='none', vmin=.90, vmax=1)
plt.xlabel('neighbors')
plt.ylabel('components')
plt.xticks(x, neighbors)
plt.yticks(y, components)
plt.title('KNN score heatmap')

plt.colorbar()
plt.show()
预测
knn = KNeighborsClassifier(n_neighbors=5)
knn.fit(X_train_pca[:, :35], y_train_pca)

predict_labels = knn.predict(X_submission_transformed[:, :35])
对于PCA维度的选取:在多次尝试后,采用35个维度,效果较好。需要注意的是,PCA处理后的训练数据和原始数据是不同的,所以采用PCA处理数据后,并不是选取的维度越多精确度就越好。k 选5 可以达到很好效果
生成提交文件
Submission = pd.DataFrame({
        "ImageId": range(1, predict_labels.shape[0]+1),
        "Label": predict_labels
    })

Submission.to_csv("KnnMnistSubmission.csv", index=False)

Submission.head(5)