特征量选区:age,enducation,race,sex。目标值:income。
from pyspark.mllib.linalg import Vectors,Vector
from pyspark import SparkContext
from pyspark.ml.regression import LinearRegression
from pyspark.ml.feature import VectorAssembler
from pyspark.python.pyspark.shell import spark
from pyspark.ml.feature import StringIndexer
from pyspark.sql.types import *
from pyspark.sql.functions import *
#1.读取数据
sc=SparkContext.getOrCreate()
train_data=sc.textFile("hdfs://master:9000/income.CSV")
def GetParts(line):
parts = line.split(',')
return parts[0],parts[2],parts[5],parts[6],parts[10]
train = train_data.map(lambda line: GetParts(line)) #根据逗号切割返回需要的特征变量
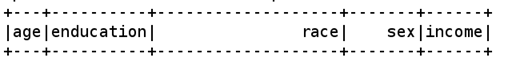
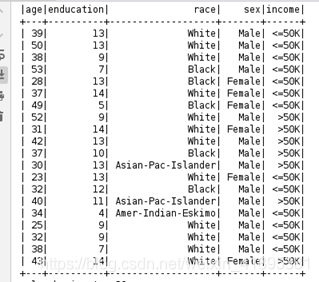
df = spark.createDataFrame(train,["age", "enducation",'race','sex','income'])#创建DataFrame格式
df.show()
indexer_1 = StringIndexer(inputCol="race", outputCol="race_index")
indexer_2 = StringIndexer(inputCol="sex", outputCol="sex_index")
indexer_3 = StringIndexer(inputCol="income", outputCol="income_index") #离散化处理
indexed_1 = indexer_1.fit(df).transform(df)
indexed_2=indexer_2.fit(indexed_1).transform(indexed_1)
indexed=indexer_3.fit(indexed_2).transform(indexed_2)
indexed=indexed.drop('race')#删除原始数据
indexed=indexed.drop('sex')
indexed=indexed.drop('income')
indexed.show()
d1 = indexed.withColumn("age", indexed["age"].cast(FloatType())) #spark不支持str类型将其转换为float类型
indexed = d1.withColumn("enducation", indexed["enducation"].cast(FloatType()))
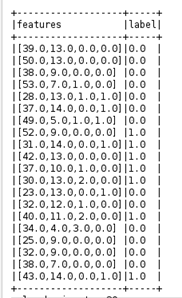
assembler = VectorAssembler(inputCols=["age", "enducation",'race_index','sex_index'],outputCol="features")
output = assembler.transform(indexed)
label_features = output.select("features", "income_index").toDF('features','label')#分类将特征量放一列,另一列为目标值
label_features.show(truncate=False)
#创建回归模型
lr = LinearRegression(maxIter=10, regParam=0.3, elasticNetParam=0.8)
lrModel = lr.fit(label_features)
print("Coefficients: %s" % str(lrModel.coefficients))
print("Intercept: %s" % str(lrModel.intercept))
trainingSummary = lrModel.summary
print("numIteraotins: %d" % trainingSummary.totalIterations)
print("objectiveHistory: %s" % str(trainingSummary.objectiveHistory))
trainingSummary.residuals.show()
print("RMSE: %f" % trainingSummary.rootMeanSquaredError)
print("r2: %f" % trainingSummary.r2)
#构造测式集数据
df1 = indexed.head(5)
df1 = spark.createDataFrame(df1)
df1.show()
test_output = assembler.transform(df1)
test_label_features = test_output.select("features", "income_index").toDF('features','label')
test_label_features.show(truncate=False)
#预测
predictions = lrModel.transform(test_label_features)
print (predictions.collect())
1.提取后的数据
2.离散化后的数据

3.分类后的数据
4.模拟预测数据

5.预测结果返回
