Decision tree algorithm is a classic algorithm series in machine learning. It can be used as both a classification algorithm and a regression algorithm, and is also particularly suitable for integrated learning such as random forests. This article summarizes the principle of decision tree algorithm. The upper part summarizes the algorithm ideas of ID3 and C4.5 and the lower section focuses on the CART algorithm. The decision tree divides the entire feature space according to the stepwise attribute classification, thus distinguishing different classification samples.
1. The information theory basis of decision tree ID3 algorithm
The machine learning algorithm is very old. As a code farmer, I often knock on if, else if, else, but I already use the idea of decision tree. Just have you thought about it, there are so many conditions, which conditional feature is used to do if, and which conditional feature is better after if? How to accurately select this standard is the key to the decision tree machine learning algorithm. In the 1970s, a geek named Quinlan found a decision-making process that used the entropy of information theory to measure the decision tree. As soon as the method came out, its simplicity and efficiency caused a sensation. Quinlan called this algorithm ID3. Let's take a look at how the ID3 algorithm chooses features.
First, we need to be familiar with the concept of entropy in information theory. Entropy measures the uncertainty of things, and the more uncertain things, the greater its entropy. Specifically, the expression of the entropy of the random variable X is as follows:
H(X)=−∑ni=1[pilogpi]
Where n represents n different discrete values of X. Pi represents the probability that X is i, and log is the logarithm of 2 or e. For example, if X has 2 possible values, and the two values are 1/2 each, the entropy of X is the largest, and X has the greatest uncertainty. The value is H(X)=−(1/2log1/2+1/2log1/2)=log2. If one value has a probability greater than 1/2 and the other has a probability less than 1/2, the uncertainty decreases and the corresponding entropy decreases. For example, a probability 1/3, a probability 2/3, then the corresponding entropy is H(X)=−(1/3log1/3+2/3log2/3)=log3−2/3log2 < log2.
Familiar with the entropy of a variable X, it is easy to generalize to the joint entropy of multiple variables, here is the joint entropy expression of two variables X and Y:
H(X,Y)=−∑ni=1[p(xi,yi)logp(xi,yi)]
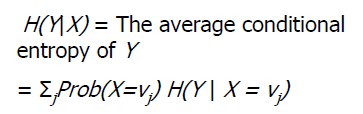
With joint entropy, the expression H(X|Y) of conditional entropy can be obtained. Conditional entropy is similar to conditional probability, which measures the uncertainty of our X after knowing Y. The expression is as follows:
H(X|Y)=−∑ni=1[p(xi,yi)logp(xi|yi)]=∑nj=1[p(yj)H(X|yj)]
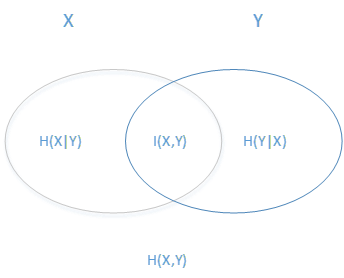
Ok, after a big lap, I can finally go back to the ID3 algorithm. We just mentioned that H(X) measures the uncertainty of X. The conditional entropy H(X|Y) measures the uncertainty of X after we know Y, then H(X)-H(X|Y )? As can be seen from the above description, it measures the degree of uncertainty of X after knowing Y. This measure is called mutual information in information theory, and is recorded as I(X, Y). It is called information gain in the decision tree ID3 algorithm. The ID3 algorithm uses information gain to determine what features the current node should use to build a decision tree. The greater the information gain, the more suitable it is for classification.
Above a bunch of concepts, we are estimated to be dizzy, it is easy to understand their relationship with the following figure. The ellipse on the left represents H(X), the ellipse on the right represents H(Y), the overlap in the middle is our mutual information or information gain I(X,Y), and the left ellipse removes the coincident part as H(X|Y) The ellipse on the right side removes the coincident part and is H(Y|X). The sum of the two ellipse is H(X, Y).
-----------------------------------------------------------------------------------------------------------------------------------------------------------------------------
Attach Note: Entropy & Information Gain Concept Interpretation
1. Information entropy:
H(X) describes the amount of information carried by X. The greater the amount of information (the more the value changes), the more uncertain it is and the less likely it is to be predicted.
For the problem of coin flipping, there are 2 cases at a time, the information entropy is 1
For the problem of casting a dice, there are 6 cases at a time, the information entropy is 1.75.
The following is the formula:

Where log2(p) can be understood as p, which needs to be represented by several bits. For example, p(x1)=1/2, p(x2)=1/4, p(x3)=1/8, p(x4)=1/8,
It can be represented by x1: 1, x2: 10, x3: 110, x4: 111, because the bit with the higher probability is set to be shorter in order to minimize the average bit position. And -log2(p) corresponds to the number of bits.
Then H(X) can be understood as the expected value of the bit.
Characteristics of information entropy: (with a probability of 1 as a premise)
- a) The more uniform the probability distribution of different categories, the greater the information entropy;
- b) The more the number of categories, the larger the information entropy;
- c) The larger the information entropy, the less likely it is to be predicted; (the number of changes is large, the smaller the difference between changes, the less likely it is to be predicted) (for deterministic problems, the information entropy is 0; p=1; E=p *logp=0)
2. Information Gain IG(Y|X): Measures the ability of an attribute (x) to distinguish between samples (y). When a new attribute (x) is added, the change in the information entropy H(Y) is the information gain. The larger IG(Y|X), the more important x is.
Conditional entropy: H(Y|X), information entropy of Y under X condition
Information gain: IG(Y|X)=H(Y)-H(Y|X)
- Entropy: In information theory and probability statistics, entropy is a measure of the uncertainty of a random variable.
- Conditional entropy: A measure of the uncertainty of a random variable Y under the condition of a random variable X.
- Information gain: The information gain indicates the degree to which the information of the feature X is known to reduce the uncertainty of the information of the class Y.
- Information gain ratio: the ratio of the information gain g(D, A) to the entropy HA(D) of the training data set D with respect to the value of the feature A.
- Gini index: Gini (D) represents the uncertainty of set D. The larger the Gini index, the greater the uncertainty of the sample set, which is similar to entropy.
-----------------------------------------------------------------------------------------------------------------------------------------------------------------------------