版权声明:更多资料请关注公众号【一行数据】即可领取 https://blog.csdn.net/qq_42554007/article/details/82947425
学习一个东西之前要认清学的是什么
啥是机器学习?
机器学习就算用数据的语言,通过计算来进行回归和预测
包括监督学习,非监督学习,强化学习,深度学习
监督学习:就是用含有标签的数据进行在各种数学模型中进行运算,得到具有比较好正确率的参数,可以在未知的数据中预测标签
那么先用一个小代码来理解一下
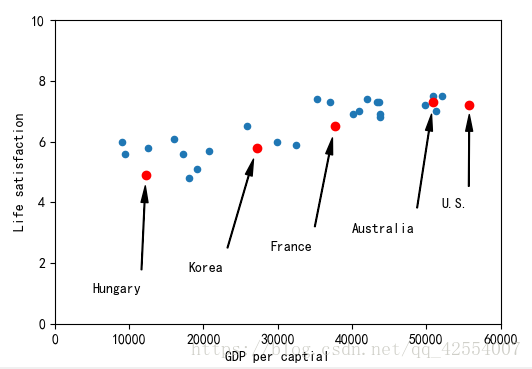
用回归模型来看幸福感和城市富裕程度的关系
(相关数据请关注公众号‘一行数据’,回复“机器学习sklearn”可免费获得)
import matplotlib.pyplot as plt
import numpy as np
import pandas as pd
from sklearn import linear_model

#首先处理幸福的数据
#加载数据
oecd_bli = pd.read_csv("oecd_bli_2015.csv",thousands = ',')
oecd_bli = oecd_bli[oecd_bli['Inequality']=='Total']
oecd_bli = oecd_bli.pivot(index = 'Country', columns = 'Indicator',values = 'Value')

#接着处理gdp的数据
gdp_per_capita = pd.read_csv('gdp_per_capita.csv',thousands = ',',
                             delimiter = '\t', encoding ='latin1',na_values = 'n/a')
gdp_per_capita.rename(columns = {'2015':'GDP per captial'},inplace = True)
gdp_per_capita.set_index('Country', inplace = True)
gdp_per_capita.head(2)

#将两张表融合在一起

full_country_stats = pd.merge(left = oecd_bli, right = gdp_per_capita,
                              left_index = True, right_index = True)
full_country_stats.sort_values(by = 'GDP per captial', inplace = True)

#划分数据
remove_indices = [0,1,6,8,33,34,35]
keep_indices = list(set(range(36)) - set(remove_indices))
sample_data = full_country_stats[["GDP per captial",'Life satisfaction']].iloc[keep_indices]
missing_data = full_country_stats[["GDP per captial","Life satisfaction"]].iloc[remove_indices]

#画图
sample_data.plot(kind = 'scatter',x= 'GDP per captial',y = 'Life satisfaction', figsize = (5,3))
plt.axis([0,60000,0,10])
position_text = {
        "Hungary":(5000,1),
        "Korea":(18000,1.7),
        "France":(29000,2.4),
        "Australia":(40000,3.0),
        "United States":(52000,3.8)
        }
for country, pos_text in position_text.items():
    pos_data_x, pos_data_y = sample_data.loc[country]
    if country == "United States" : country = 'U.S.'
    else: country
    plt.annotate(country, xy = (pos_data_x, pos_data_y), xytext = pos_text,
                 arrowprops = dict(facecolor = 'black', width = 0.5, shrink = 0.1, headwidth = 5))
    plt.plot(pos_data_x,pos_data_y,'ro')
#选择线性模型
country_stats = sample_data
x = np.c_[country_stats['GDP per captial']]
y = np.c_[country_stats['Life satisfaction']]
# Visualize the data
country_stats.plot(kind='scatter', x="GDP per captial", y='Life satisfaction')
plt.show()
#选择线性模型
lin_reg_model = linear_model.LinearRegression()
lin_reg_model.fit(x, y)
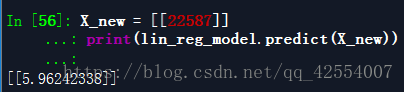
#Make a prediction for Cyprus
X_new = [[22587]]
print(lin_reg_model.predict(X_new))