xy plot
#set terminal jpeg
#set output 'alfa.jpg'
set terminal postscript eps font 24
set out 'U_vs_X_tsr5.eps'
#set terminal X11
set autoscale
unset log
unset label
unset pm3d
set key at graph .99, .58
set key spacing 1
set xtic auto
set ytic auto
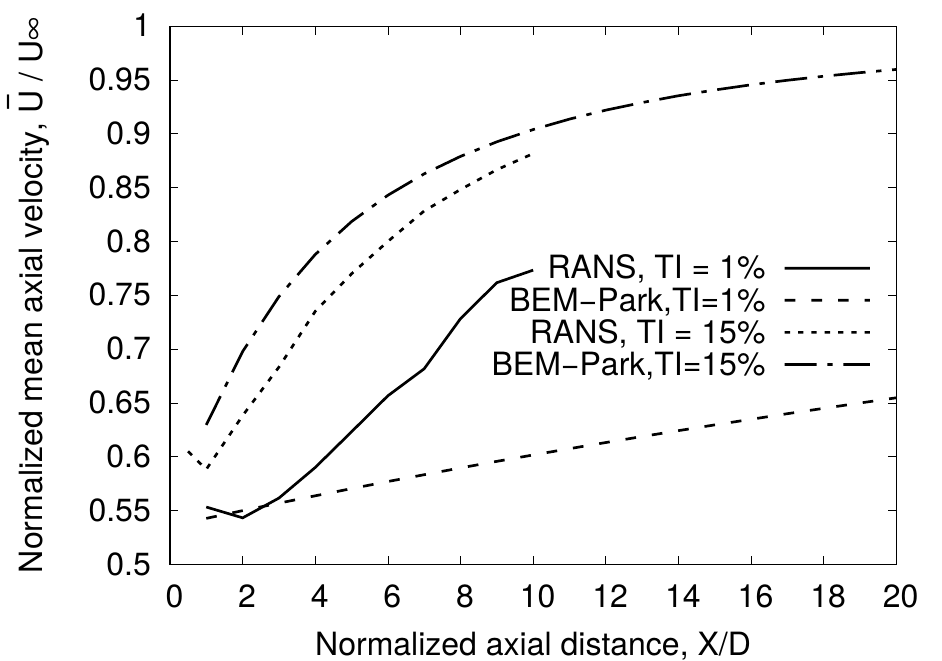
set xlabel "Normalized axial distance, X/D"
set xrange [*:*]
# r0 initial pulse
set yrange [*:*]
set ylabel "Normalized mean axial velocity, ~U{0.8-} / U{/Symbol \245}"
set style line 1 lt 1 lc rgb "black" lw 4 pt 1 ps 2
set style line 2 lt 2 lc rgb "black" lw 4 pt 3 ps 2
set style line 3 lt 3 lc rgb "black" lw 4 pt 5 ps 2
set style line 4 lt 4 lc rgb "black" lw 4 pt 7 ps 2
set style line 5 lt 5 lc rgb "black" lw 4
set style line 6 lt 6 lc rgb "brown" lw 4
#set label 1 "TSR 5" at graph .8, .9
plot "cfd/area_averaged_axial_mean_velocity_TI_1.txt" using 1:6 t "RANS, TI = 1%" ls 1 with lines,\
"park_model/wave_axial_velocity_tsr5_park_TI_1.txt" using 1:2 t "BEM-Park,TI=1%" ls 2 with lines,\
"cfd/area_averaged_axial_mean_velocity_TI_15.txt" using 1:6 t "RANS, TI = 15%" ls 3 with lines,\
"park_model/wave_axial_velocity_tsr5_park_TI_15.txt" using 1:2 t "BEM-Park,TI=15%" ls 4 with lines
example 2
important code
set key out horiz center top
#set terminal jpeg
#set output 'coeff_epp.jpg'
#set terminal png
#set output 'coeff_epp.png'
set terminal postscript eps font 24
set out 'coeff_naca0012.eps'
#set terminal X11
set autoscale
unset log
unset label
unset pm3d
set key out horiz center top
set xtic auto
set ytic auto
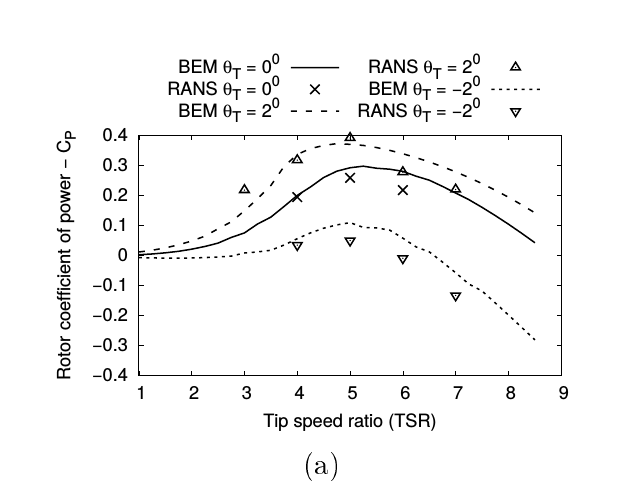
set xlabel "Tip speed ratio (TSR)"
set xrange [1:*]
# r0 initial pulse
set yrange [-0.4:0.4]
set ylabel "Rotor coefficient of power - C_P"
set style line 1 lt 1 lc rgb "black" lw 4 pointtype 2 pointsize 2
set style line 2 lt 2 lc rgb "black" lw 4 pointtype 7 pointsize 2
set style line 3 lt 3 lc rgb "black" lw 4 pointtype 6 pointsize 2
set style line 4 lt 4 lc rgb "black" lw 4 pointtype 8 pointsize 2
set style line 5 lt 5 lc rgb "black" lw 4 pointtype 10 pointsize 2
set style line 6 lt 6 lc rgb "brown" lw 4 pointtype 12 pointsize 2
set pointsize 2
set bars 3
plot "naca0012/re_135k/zero/coeff.plt" using 1:4 t "BEM {/Symbol q}_T = 0^{0}" ls 1 with lines ,\
"RANS/Cp_Ct_tsr_one_untwist.dat" using 1:2 t "RANS {/Symbol q}_T = 0^{0}" ls 1 with points ,\
"naca0012/re_135k/fwd_2/coeff.plt" using 1:4 t "BEM {/Symbol q}_T = 2^{0}" ls 2 with lines,\
"RANS/Cp_one_front_eldad_blade.dat" using 1:2 t "RANS {/Symbol q}_T = 2^{0}" ls 4 with points,\
"naca0012/re_135k/rear_2/coeff.plt" using 1:4 t "BEM {/Symbol q}_T = -2^{0}" ls 3 with lines,\
"RANS/Cp_Ct_tsr_one_rear.dat" using 1:2 t "RANS {/Symbol q}_T = -2^{0}" ls 5 with points