版本:gnuplot 5.2 patchlevel 2
解决了无数次了还是反复忘,气,遂记。
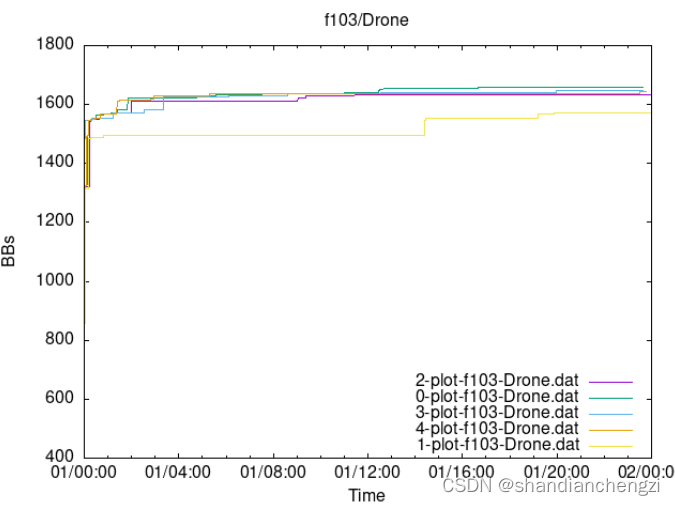
下列程序的功能:
读取文件夹下的所有dat文件,并把所有dat的结果画在一张图里并标好图例:
set term png
set output "output.png"
set xdata time
set timefmt "%d/%H:%M"
set format x "%d/%H:%M"
set xlabel "Time"
set ylabel "BBs"
set title "f103/Drone"
set xtics 14400
set key right bottom

# Find .dat files in the current directory
file_list = system("find . -maxdepth 1 -name '*.dat' -printf '%f\n'")

# Loop through the files and add plot commands
plot for [dataset in file_list] dataset using 1:2 with lines title dataset

# another way:
# plot word(file_list, 1) using 1:2 with lines title "TEST1", \
#      word(file_list, 2) using 1:2 with lines title "TEST2", \
#      word(file_list, 3) using 1:2 with lines title "TEST3", \
#      word(file_list, 4) using 1:2 with lines title "TEST4", \
#      word(file_list, 5) using 1:2 with lines title "TEST5", \
结果: