sql优化一般步骤概要:
- 通过
show status命令了解各种sql的执行频率 - 定位执行效率较低的sql语句
- 通过
explain分析低效sql的执行计划 - 通过
show profile分析sql - 通过trace分析 优化器 如何选择执行计划
- 确定问题并采取相应的优化措施
以下阐述每步具体操作,请详细跟进操作,会有不错的收货!
1 通过 show status 命令了解各种sql的执行频率
mysql客户端连接成功后,通过show[session|global] status命令,可以查看服务器的状态,如果不加默认为session(session级为当前连接的统计结果,global级为自数据库上次启动到现在的统计结果)。
Eg: show status like 'Com_%';
…图示内容还有好多,不一一展示。
com_xx表示每个xx语句的执行次数,通常着重看curd操作次数(这些参数适用于所有存储引擎);
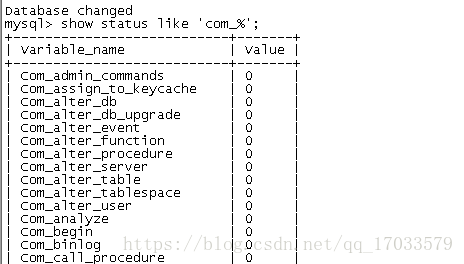
- Com_insert:执行select操作的次数,一次查询只累加1;
- Com_select:执行insert操作的次数,批量插入的insert操作只累加一次;
- Com_delete:执行update操作次数,提交和回滚均会累加;
- Com_update:执行delete操作次数。
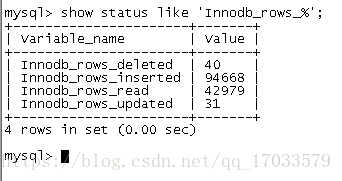
针对innodb存储引擎的表操作,累加的算法比如:show status like 'Innodb_rows_%';
- Innodb_rows_deleted :执行delete操作删除的行数;
- Innodb_rows_inserted:执行insert操作插入的行数;
- Innodb_rows_read :select查询返回的函数;
- Innodb_rows_updated: update操作更新的函数。
通过截图,可以了解到当前数据库是以插入和查询为主,以及各种类型操作的执行比例。
对于事务型的应用,通过com_commit 和com_rollback可以了解事务提交和回滚的情况,对于回滚特别频繁的操作,可能意味着代码编写有问题。
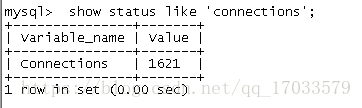
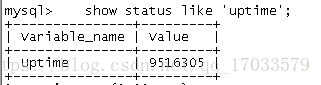
以下操作用户了解数据库的基本情况:
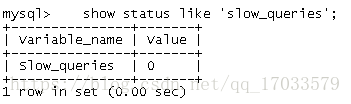
show status like ‘connections’;-- 试图连接mysql数据库的次数
show status like ‘uptime’;-- 服务器工作时间
show status like ‘slow_queries’; – 慢查询的次数
2 定位执行效率较低的sql语句
- 通过慢查询日志定位哪些sql执行效率低下,用–log-slow-queries[=file_name]选项启动时,mysqld写一个包含所有执行时间超过long_query_time 秒的sql语句的日志文件,具体可参看后面的日志管理部分。
- 慢查询日志在查询结束以后才记录,所以在应用反正执行效率出现问题的时候查询慢查询日志并不能定位问题,可以使用show processlist命令查看当前mysql在进行的线程,包括线程的状态,是否锁表等,可以实时查看sql的执行情况,同时对一些锁表操作进行优化。
mysql> show processlist;
+------+------+-----------+------+---------+------+-------+------------------+
| Id   | User | Host      | db   | Command | Time | State | Info             |
+------+------+-----------+------+---------+------+-------+------------------+
| 1619 | root | localhost | wq   | Query   |    0 | init  | show processlist |
+------+------+-----------+------+---------+------+-------+------------------+
1 row in set (0.00 sec)
3 通过explain分析低效sql的执行计划
追查到效率低的sql后,可以通过explain或desc命令获取mysql如何执行select语句的信息,包括在select语句执行过程中表如何连接和连接的顺序,eg:统计某个email为租赁电影拷贝所支付的总金额,需要关联客户表customer和付款表payment,并且对付款金额amount字段做求和操作,相应sql的执行计划如下:
explain select sum(amount) from customer a ,payment b where 1=1 and a.customer_id=b.customer_id and email ='[email protected]'\G
 mysql> explain select sum(amount) from customer a ,payment b where 1=1 and a.customer_id=b.customer_id and email ='[email protected]'\G
*************************** 1. row ***************************
           id: 1
  select_type: SIMPLE
        table: a
         type: ALL
possible_keys: PRIMARY
          key: NULL
      key_len: NULL
          ref: NULL
         rows: 599
        Extra: Using where
*************************** 2. row ***************************
           id: 1
  select_type: SIMPLE
        table: b
         type: ref
possible_keys: idx_fk_customer_id
          key: idx_fk_customer_id
      key_len: 2
          ref: wq.a.customer_id
         rows: 13
        Extra: NULL
2 rows in set (0.00 sec)
下面对每个列进行简单说明:
select_type:表示select的类型,常见取值 simple(简单表,即不适用表连接或者子查询),primary(主查询,即外层的查询),union(union中的第二个或者后面的查询语句),subquery(子查询中的第一个select)等。
table:输出结果集的表。
possible_keys:表示查询时可能使用的索引,不表示出现在这里的就是表的全部索引。
key:表示实际使用的索引。
key_len:使用到索引字段的长度。
rows:扫描行的数量。
extra:执行情况的说明和描述,包含不适合在其他列中显示但是对执行计划非常重要的额外信息。
type:表示mysql在表中找到所需行的方式,或者叫访问类型,常见如下(性能由左至右由最差变道最好):all 、 index 、 range 、 ref、 eq_ref 、 const,system 、 null
补充:类型type还有其他的值:
ref_or_null:和ref类似,区别在于条件中包含对null的查询
index_merge:索引合并优化
unique_subquery:in的后面是一个查询主键字段的子查询
index_subquery:与unique_subquery类似,区别在于in的后面是查询非唯一索引字段的子查询。
我们可以试下大概什么情况会取type类型的值:
(1)type=all,表示全表扫描,mysql遍历全表来找到匹配的行:
mysql> explain select * from film where rating >9\G
*************************** 1. row ***************************
           id: 1
  select_type: SIMPLE
        table: film
         type: ALL
possible_keys: NULL
          key: NULL
      key_len: NULL
          ref: NULL
         rows: 1000
        Extra: Using where
1 row in set (0.00 sec)
(2)type=index ,索引全表扫描,mysql遍历整个索引来查询匹配的行:
mysql> explain select title from film\G
*************************** 1. row ***************************
           id: 1
  select_type: SIMPLE
        table: film
         type: index
possible_keys: NULL
          key: idx_title
      key_len: 767
          ref: NULL
         rows: 1000
        Extra: Using index
1 row in set (0.00 sec)
(3)type=range,索引范围扫描,常见于 < 、 <=、 >、 >= 、 between 等操作符:
mysql> explain select * from payment where customer_id>=300 and customer_id<=350\G
*************************** 1. row ***************************
           id: 1
  select_type: SIMPLE
        table: payment
         type: range
possible_keys: idx_fk_customer_id
          key: idx_fk_customer_id
      key_len: 2
          ref: NULL
         rows: 1349
        Extra: Using index condition
1 row in set (0.00 sec)
(4) type=ref ,使用非唯一索引扫描或唯一索引的前缀扫描,返回匹配某个单独值的记录行,eg:
mysql> EXPLAIN select * from payment where customer_id=350\G
*************************** 1. row ***************************
           id: 1
  select_type: SIMPLE
        table: payment
         type: ref
possible_keys: idx_fk_customer_id
          key: idx_fk_customer_id
      key_len: 2
          ref: const
         rows: 23
        Extra: NULL
1 row in set (0.00 sec)
'idx_fk_customer_id’索引是非唯一索引,查询条件为等值查询条件 customer_id=35,所以扫描索引的类型为ref.ref还经常出现在join操作中:
如:
mysql> explain select a.*,b.* from payment a,customer b where a.customer_id=b.customer_id\G
*************************** 1. row ***************************
           id: 1
  select_type: SIMPLE
        table: b
         type: ALL
possible_keys: PRIMARY
          key: NULL
      key_len: NULL
          ref: NULL
         rows: 599
        Extra: NULL
*************************** 2. row ***************************
           id: 1
  select_type: SIMPLE
        table: a
         type: ref
possible_keys: idx_fk_customer_id
          key: idx_fk_customer_id
      key_len: 2
          ref: wq.b.customer_id
         rows: 13
        Extra: NULL
2 rows in set (0.00 sec)
(5)type=eq_ref ,类似ref ,区别就在使用的索引是唯一索引,对于每个索引键值,表中只有一条记录匹配;简单说即多表连接中使用primary key或者unique index作为关联条件。
mysql> explain select * from film a,film_text b where a.film_id=b.film_id\G
*************************** 1. row ***************************
           id: 1
  select_type: SIMPLE
        table: b
         type: ALL
possible_keys: PRIMARY
          key: NULL
      key_len: NULL
          ref: NULL
         rows: 1000
        Extra: NULL
*************************** 2. row ***************************
           id: 1
  select_type: SIMPLE
        table: a
         type: eq_ref
possible_keys: PRIMARY
          key: PRIMARY
      key_len: 2
          ref: wq.b.film_id
         rows: 1
        Extra: Using where
2 rows in set (0.00 sec)
(6)TYPE=const/system ,单表中最多有一个匹配行,查询起来非常迅速,所以这个匹配行中的其他列的值可以被优化器在当前查询中当做常量来处理,例如,根据主键primary key 或者唯一索引unique index进行的查询。下面构造一个查询:
mysql> alter table customer add unique index  uk_email(email);
Query OK, 0 rows affected (0.10 sec)
Records: 0  Duplicates: 0  Warnings: 0
mysql> explain  select * from (select * from customer where email='[email protected]')a\G
*************************** 1. row ***************************
           id: 1
  select_type: PRIMARY
        table: <derived2>
         type: system
possible_keys: NULL
          key: NULL
      key_len: NULL
          ref: NULL
         rows: 1
        Extra: NULL
*************************** 2. row ***************************
           id: 2
  select_type: DERIVED
        table: customer
         type: const
possible_keys: uk_email
          key: uk_email
      key_len: 153
          ref: const
         rows: 1
        Extra: NULL
2 rows in set (0.00 sec)
mysql> explain select * from  film_text b where  b.film_id=22\G
*************************** 1. row ***************************
           id: 1
  select_type: SIMPLE
        table: b
         type: const
possible_keys: PRIMARY
          key: PRIMARY
      key_len: 2
          ref: const
         rows: 1
        Extra: NULL
1 row in set (0.01 sec)
以上可以看出,通过唯一索引 uk_email访问的时候,类型为type=const;而从只有一条记录的a表中查询数据时,类型type就为system。
(7)type=null ,mysql 不用访问表或者索引,直接能得到结果,eg:
mysql> explain select 1 from dual where 1\G
*************************** 1. row ***************************
           id: 1
  select_type: SIMPLE
        table: NULL
         type: NULL
possible_keys: NULL
          key: NULL
      key_len: NULL
          ref: NULL
         rows: NULL
        Extra: No tables used
1 row in set (0.00 sec)
mysql4.1开始引入了explain extended命令,通过explain extended加上show warnings,可以看到sql真正被执行之后,优化器做了哪些sql改写:
mysql> explain extended select sum(amount) from customer a,payment b where 1=1 and a.customer_id=b.customer_id and email='[email protected]'\G
*************************** 1. row ***************************
           id: 1
  select_type: SIMPLE
        table: a
         type: const
possible_keys: PRIMARY,uk_email
          key: uk_email
      key_len: 153
          ref: const
         rows: 1
     filtered: 100.00
        Extra: Using index
*************************** 2. row ***************************
           id: 1
  select_type: SIMPLE
        table: b
         type: ref
possible_keys: idx_fk_customer_id
          key: idx_fk_customer_id
      key_len: 2
          ref: const
         rows: 28
     filtered: 100.00
        Extra: NULL
2 rows in set, 1 warning (0.00 sec)

mysql> show warnings\G
*************************** 1. row ***************************
  Level: Note
   Code: 1003
Message: /* select#1 */ select sum(`wq`.`b`.`amount`) AS `sum(amount)` from `wq`.`customer` `a` join `wq`.`payment` `b` where ((`wq`.`b`.`customer_id` = '77') and ('[email protected]' = '[email protected]'))
1 row in set (0.00 sec)
以上结果可以看到:
- explain extended输出结果中多了filtered字段,
- 同时从warning的message字段能够看到优化器自动去除了1=1 恒成立的条件,也就是说优化器在改写sql的时候会自动去掉恒成立的条件。
- 在遇到复杂sql的时候,可以利用explain extended的结果获取一个更清晰易读的sql.
mysql 5.1开始支持分区功能,同时explain命令也增加了分区的功能, 可以通过explain partitions的命令查看sql所访问的分区。eg:创建一个hash分区的customer_part表,根据分区键查询的时候,能够看到explain partitions的输出结果中有一列partitions,其中显示了sql所需要访问的分区名字 p2:
mysql> create table customer_part(customer_id smallint(5) unsigned not null auto_increment,primary key(customer_id))partition by hash(customer_id) partitions 8;
Query OK, 0 rows affected (0.26 sec)


mysql> insert into customer_part select customer_id from customer;
Query OK, 599 rows affected (0.01 sec)
Records: 599  Duplicates: 0  Warnings: 0

mysql> explain partitions select * from customer_part where customer_id=130\G
*************************** 1. row ***************************
           id: 1
  select_type: SIMPLE
        table: customer_part
   partitions: p2
         type: const
possible_keys: PRIMARY
          key: PRIMARY
      key_len: 2
          ref: const
         rows: 1
        Extra: Using index
1 row in set (0.00 sec)
但是有时只通过explain分析执行计划并不能很快定位sql问题,那么如果有profile联合分析就更好了。
4 通过 show profile 分析sql
从5.0.37版本开始增加了对show profiles 和show profile的语句支持。通过having_profiling参数,可以看到sql是否支持profile:
mysql> select @@have_profiling;
+------------------+
| @@have_profiling |
+------------------+
| YES              |
+------------------+
1 row in set, 1 warning (0.00 sec)
默认profiling是关闭的,可以通过set语句在session级别开启profiling:
mysql>  select @@profiling;
+-------------+
| @@profiling |
+-------------+
|           0 |
+-------------+
1 row in set, 1 warning (0.00 sec)
可以直接set其值为1
mysql> set profiling=1;
Query OK, 0 rows affected, 1 warning (0.00 sec)
通过profile我们可以大致了解sql执行的过程。例如myisam表有表元数据的缓存(比如行数,即count(*)值),那么对一个myisam表的count(*)是不需要消耗太多资源的,而对于innodb来说,就没有这种元数据缓存,count(*)执行的较慢。下面来做个试验验证下。
首先,在一个innodb引擎的付款表payment上,执行一个count(*)查询:
mysql> select count(*) from payment;
+----------+
| count(*) |
+----------+
|    16049 |
+----------+
1 row in set (0.00 sec)
执行完毕后,通过show profiles语句,看到当前sql的query id为1:
mysql> show profiles;
+----------+------------+------------------------------+
| Query_ID | Duration   | Query                        |
+----------+------------+------------------------------+
|        1 | 0.00372550 | select count(*) from payment |
+----------+------------+------------------------------+
1 row in set, 1 warning (0.00 sec)
通过show profile for query 1;语句能够看到执行过程中线程的每个状态和消耗的时间:
mysql> show profile for query 1;
+----------------------+----------+
| Status               | Duration |
+----------------------+----------+
| starting             | 0.000082 |
| checking permissions | 0.000008 |
| Opening tables       | 0.000022 |
| init                 | 0.000017 |
| System lock          | 0.000008 |
| optimizing           | 0.000006 |
| statistics           | 0.000014 |
| preparing            | 0.000012 |
| executing            | 0.000003 |
| Sending data         | 0.003496 |
| end                  | 0.000007 |
| query end            | 0.000006 |
| closing tables       | 0.000010 |
| freeing items        | 0.000011 |
| cleaning up          | 0.000025 |
+----------------------+----------+
15 rows in set, 1 warning (0.00 sec)
状态值为sending data表示mysql线程开始访问数据行并把结果返回给客户端之前,mysql线程要做大良的磁盘读取操作,所以会导致在整个查询中耗时最长的状态。
通过执行show profile for query,可以看到在执行count(*)操作的过程中,时间耗费在状态值为sending data 上,通过查询 information_schema.profiling表并按照时间做个desc排序:
mysql> select state,sum(duration) as total_r,round(100*sum(duration)/(select sum(duration) from information_schema.profiling where query_id=@query_id),2) as pct_r,count(*) as calls,sum(duration)/count(*) as "R/Call" from information_schema.profiling where query_id=@query_id group by state order by  total_r desc;
+----------------------+----------+-------+-------+--------------+
| state                | total_r  | pct_r | calls | R/Call       |
+----------------------+----------+-------+-------+--------------+
| Sending data         | 0.003496 | 93.80 |     1 | 0.0034960000 |
| starting             | 0.000082 |  2.20 |     1 | 0.0000820000 |
| cleaning up          | 0.000025 |  0.67 |     1 | 0.0000250000 |
| Opening tables       | 0.000022 |  0.59 |     1 | 0.0000220000 |
| init                 | 0.000017 |  0.46 |     1 | 0.0000170000 |
| statistics           | 0.000014 |  0.38 |     1 | 0.0000140000 |
| preparing            | 0.000012 |  0.32 |     1 | 0.0000120000 |
| freeing items        | 0.000011 |  0.30 |     1 | 0.0000110000 |
| closing tables       | 0.000010 |  0.27 |     1 | 0.0000100000 |
| System lock          | 0.000008 |  0.21 |     1 | 0.0000080000 |
| checking permissions | 0.000008 |  0.21 |     1 | 0.0000080000 |
| end                  | 0.000007 |  0.19 |     1 | 0.0000070000 |
| query end            | 0.000006 |  0.16 |     1 | 0.0000060000 |
| optimizing           | 0.000006 |  0.16 |     1 | 0.0000060000 |
| executing            | 0.000003 |  0.08 |     1 | 0.0000030000 |
+----------------------+----------+-------+-------+--------------+
15 rows in set (0.00 sec)
获取到最消耗时间的线程状态后,mysql进一步选择all,cpu,block io,context switch,page faults等明细类型来查看mysql在使用什么资源上耗费了过高的时间,例如,选择查看cpu的耗费时间:
mysql> show profile cpu for query 1;
+----------------------+----------+----------+------------+
| Status               | Duration | CPU_user | CPU_system |
+----------------------+----------+----------+------------+
| starting             | 0.000065 | 0.000027 |   0.000028 |
| checking permissions | 0.000007 | 0.000003 |   0.000004 |
| Opening tables       | 0.000021 | 0.000011 |   0.000011 |
| init                 | 0.000014 | 0.000007 |   0.000007 |
| System lock          | 0.000009 | 0.000004 |   0.000005 |
| optimizing           | 0.000007 | 0.000003 |   0.000003 |
| statistics           | 0.000013 | 0.000007 |   0.000007 |
| preparing            | 0.000012 | 0.000005 |   0.000006 |
| executing            | 0.000003 | 0.000002 |   0.000002 |
| Sending data         | 0.003683 | 0.003684 |   0.000000 |
| end                  | 0.000007 | 0.000006 |   0.000000 |
| query end            | 0.000006 | 0.000006 |   0.000000 |
| closing tables       | 0.000009 | 0.000009 |   0.000000 |
| freeing items        | 0.000010 | 0.000010 |   0.000000 |
| cleaning up          | 0.000014 | 0.000014 |   0.000000 |
+----------------------+----------+----------+------------+
15 rows in set, 1 warning (0.00 sec)
可想而知,sending data状态值大的原因为时间主要耗费在cpu的操作上了,对比myisam表的count(*)操作,也创建一个同样表结构的myisam表,数据量也完全一致。
mysql> create table payment_myisam like payment;
Query OK, 0 rows affected (0.04 sec)

mysql> alter table payment_myisam engine=myisam;
Query OK, 0 rows affected (0.04 sec)
Records: 0  Duplicates: 0  Warnings: 0

mysql> insert into payment_myisam select * from payment;
Query OK, 16049 rows affected (0.08 sec)
Records: 16049  Duplicates: 0  Warnings: 0
执行count(*),显示profile:
mysql> select count(*) from payment_myisam;
+----------+
| count(*) |
+----------+
|    16049 |
+----------+
1 row in set (0.00 sec)

mysql> show profiles;
+----------+------------+--------------------------------------------------------------------------------------------------------------------------------------+
| Query_ID | Duration   | Query                                                                                                                                |
+----------+------------+--------------------------------------------------------------------------------------------------------------------------------------+
|        1 | 0.00016550 | select @@have_profiling                                                                                                              |
|        2 | 0.00387925 | select count(*) from payment                                                                                                         |
|        3 | 0.00005900 | show profile context switch for query 2                                                                                              |
|        4 | 0.00007175 | create table payment_myisam lkike payment                                                                                            |
|        5 | 0.04542150 | create table payment_myisam like payment                                                                                             |
|        6 | 0.03682200 | alter table payment_myisam engine=myisam                                                                                             |
|        7 | 0.08007525 | insert into payment_myisam select * from payment                                                                                     |
|        8 | 0.00005425 | mysql> create table payment_myisam like payment                                                                                      |
|        9 | 0.00005275 | Query OK, 0 rows affected (0.04 sec)

mysql> alter table payment_myisam engine=myisam                                                |
|       10 | 0.00005300 | Query OK, 0 rows affected (0.04 sec)
Records: 0  Duplicates: 0  Warnings: 0

mysql> insert into payment_myisam select * from payment |
|       11 | 0.00006350 | Query OK, 16049 rows affected (0.08 sec)
Records: 16049  Duplicates: 0  Warnings: 0                                                  |
|       12 | 0.00016450 | select count(*) from payment_myisam                                                                                                  |
+----------+------------+--------------------------------------------------------------------------------------------------------------------------------------+
12 rows in set, 1 warning (0.00 sec)

mysql> show profile for query 12;
+----------------------+----------+
| Status               | Duration |
+----------------------+----------+
| starting             | 0.000063 |
| checking permissions | 0.000007 |
| Opening tables       | 0.000020 |
| init                 | 0.000014 |
| System lock          | 0.000009 |
| optimizing           | 0.000008 |
| executing            | 0.000010 |
| end                  | 0.000004 |
| query end            | 0.000004 |
| closing tables       | 0.000009 |
| freeing items        | 0.000008 |
| cleaning up          | 0.000012 |
+----------------------+----------+
12 rows in set, 1 warning (0.00 sec)
由上面两种引擎所建表的count(*)操作后,执行profile可看出,innodb引擎的表由sending data状态,存在访问数据即磁盘读取的过程,时间主要耗费在cpu上,而myisam引擎的表在executing之后就结束查询,意味着不需要去访问数据。
如果对mysql源码感兴趣,可以通过show profile source for query查看sql解析执行过程中的每个步骤对应的源码文件、函数名称、具体源文件行数:
mysql> show profile source for query 1;
+----------------------+----------+-----------------------+------------------+-------------+
| Status               | Duration | Source_function       | Source_file      | Source_line |
+----------------------+----------+-----------------------+------------------+-------------+
| starting             | 0.000065 | NULL                  | NULL             |        NULL |
| checking permissions | 0.000007 | check_access          | sql_parse.cc     |        5350 |
| Opening tables       | 0.000021 | open_tables           | sql_base.cc      |        5095 |
| init                 | 0.000014 | mysql_prepare_select  | sql_select.cc    |        1051 |
| System lock          | 0.000009 | mysql_lock_tables     | lock.cc          |         304 |
| optimizing           | 0.000007 | optimize              | sql_optimizer.cc |         139 |
| statistics           | 0.000013 | optimize              | sql_optimizer.cc |         365 |
| preparing            | 0.000012 | optimize              | sql_optimizer.cc |         488 |
| executing            | 0.000003 | exec                  | sql_executor.cc  |         110 |
| Sending data         | 0.003683 | exec                  | sql_executor.cc  |         190 |
| end                  | 0.000007 | mysql_execute_select  | sql_select.cc    |        1106 |
| query end            | 0.000006 | mysql_execute_command | sql_parse.cc     |        5049 |
| closing tables       | 0.000009 | mysql_execute_command | sql_parse.cc     |        5097 |
| freeing items        | 0.000010 | mysql_parse           | sql_parse.cc     |        6486 |
| cleaning up          | 0.000014 | dispatch_command      | sql_parse.cc     |        1815 |
+----------------------+----------+-----------------------+------------------+-------------+
15 rows in set, 1 warning (0.00 sec)
show profile可以在sql优化时告诉我们时间主要浪费在哪了。
5 通过trace分析 优化器 如何选择执行计划
mysql5.6是通过trace文件进一步告诉我们优化器是如何选择执行计划的。
(即mysql5.6提供了对sql的跟踪trace文件,从而得知优化器为何选择a执行计划而不选择b执行计划,有助于我们理解优化器的行为。)
首先打开trace,设置格式为json,设置trace最大能够使用内存的大小,避免解析过程中因为默认内存过小不能完全显示:
mysql> set optimizer_trace="enabled=on" ,end_markers_in_json=on;
Query OK, 0 rows affected (0.00 sec)

mysql> set optimizer_trace_max_mem_size=1000000;
Query OK, 0 rows affected (0.00 sec)
然后执行下想做追踪的sql语句,eg:租赁表中rental的库存编号inventory_id为4466的电影拷贝 ,出租日期rental_date 在2005-05-25 4:00:00~5:00:00范围内的出租记录,最后通过检查语句select * from information_schema.optimizer_trace就可以知道mysql如何执行sql的
mysql> select rental_id from rental where 1=1 and rental_date>='2005-05-25 04:00:00' and rental_date <='2005-05-25 05:00:00' and inventory_id=4466;
+-----------+
| rental_id |
+-----------+
|        39 |
+-----------+
1 row in set (0.00 sec)

mysql> select * from information_schema.optimizer_trace\G
*************************** 1. row ***************************
                            QUERY: select rental_id from rental where 1=1 and rental_date>='2005-05-25 04:00:00' and rental_date <='2005-05-25 05:00:00' and inventory_id=4466
                            TRACE: {
  "steps": [
    {
      "join_preparation": {
        "select#": 1,
        "steps": [
          {
            "expanded_query": "/* select#1 */ select `rental`.`rental_id` AS `rental_id` from `rental` where ((1 = 1) and (`rental`.`rental_date` >= '2005-05-25 04:00:00') and (`rental`.`rental_date` <= '2005-05-25 05:00:00') and (`rental`.`inventory_id` = 4466))"
          }
        ] /* steps */
      } /* join_preparation */
    },
    {
      "join_optimization": {
        "select#": 1,
        "steps": [
          {
            "condition_processing": {
              "condition": "WHERE",
              "original_condition": "((1 = 1) and (`rental`.`rental_date` >= '2005-05-25 04:00:00') and (`rental`.`rental_date` <= '2005-05-25 05:00:00') and (`rental`.`inventory_id` = 4466))",
              "steps": [
                {
                  "transformation": "equality_propagation",
                  "resulting_condition": "((1 = 1) and (`rental`.`rental_date` >= '2005-05-25 04:00:00') and (`rental`.`rental_date` <= '2005-05-25 05:00:00') and multiple equal(4466, `rental`.`inventory_id`))"
                },
                {
                  "transformation": "constant_propagation",
                  "resulting_condition": "((1 = 1) and (`rental`.`rental_date` >= '2005-05-25 04:00:00') and (`rental`.`rental_date` <= '2005-05-25 05:00:00') and multiple equal(4466, `rental`.`inventory_id`))"
                },
                {
                  "transformation": "trivial_condition_removal",
                  "resulting_condition": "((`rental`.`rental_date` >= '2005-05-25 04:00:00') and (`rental`.`rental_date` <= '2005-05-25 05:00:00') and multiple equal(4466, `rental`.`inventory_id`))"
                }
              ] /* steps */
            } /* condition_processing */
          },
          {
            "table_dependencies": [
              {
                "table": "`rental`",
                "row_may_be_null": false,
                "map_bit": 0,
                "depends_on_map_bits": [
                ] /* depends_on_map_bits */
              }
            ] /* table_dependencies */
          },
          {
            "ref_optimizer_key_uses": [
              {
                "table": "`rental`",
                "field": "inventory_id",
                "equals": "4466",
                "null_rejecting": false
              }
            ] /* ref_optimizer_key_uses */
          },
          {
            "rows_estimation": [
              {
                "table": "`rental`",
                "range_analysis": {
                  "table_scan": {
                    "rows": 16008,
                    "cost": 3300.7
                  } /* table_scan */,
                  "potential_range_indices": [
                    {
                      "index": "PRIMARY",
                      "usable": false,
                      "cause": "not_applicable"
                    },
                    {
                      "index": "rental_date",
                      "usable": true,
                      "key_parts": [
                        "rental_date",
                        "inventory_id",
                        "customer_id"
                      ] /* key_parts */
                    },
                    {
                      "index": "idx_fk_inventory_id",
                      "usable": true,
                      "key_parts": [
                        "inventory_id",
                        "rental_id"
                      ] /* key_parts */
                    },
                    {
                      "index": "idx_fk_customer_id",
                      "usable": false,
                      "cause": "not_applicable"
                    },
                    {
                      "index": "idx_fk_staff_id",
                      "usable": false,
                      "cause": "not_applicable"
                    }
                  ] /* potential_range_indices */,
                  "best_covering_index_scan": {
                    "index": "rental_date",
                    "cost": 3229.9,
                    "chosen": true
                  } /* best_covering_index_scan */,
                  "setup_range_conditions": [
                  ] /* setup_range_conditions */,
                  "group_index_range": {
                    "chosen": false,
                    "cause": "not_group_by_or_distinct"
                  } /* group_index_range */,
                  "analyzing_range_alternatives": {
                    "range_scan_alternatives": [
                      {
                        "index": "rental_date",
                        "ranges": [
                          "2005-05-25 04:00:00 <= rental_date <= 2005-05-25 05:00:00"
                        ] /* ranges */,
                        "index_dives_for_eq_ranges": true,
                        "rowid_ordered": false,
                        "using_mrr": false,
                        "index_only": true,
                        "rows": 10,
                        "cost": 3.0254,
                        "chosen": true
                      },
                      {
                        "index": "idx_fk_inventory_id",
                        "ranges": [
                          "4466 <= inventory_id <= 4466"
                        ] /* ranges */,
                        "index_dives_for_eq_ranges": true,
                        "rowid_ordered": true,
                        "using_mrr": false,
                        "index_only": false,
                        "rows": 5,
                        "cost": 7.01,
                        "chosen": false,
                        "cause": "cost"
                      }
                    ] /* range_scan_alternatives */,
                    "analyzing_roworder_intersect": {
                      "usable": false,
                      "cause": "too_few_roworder_scans"
                    } /* analyzing_roworder_intersect */
                  } /* analyzing_range_alternatives */,
                  "chosen_range_access_summary": {
                    "range_access_plan": {
                      "type": "range_scan",
                      "index": "rental_date",
                      "rows": 10,
                      "ranges": [
                        "2005-05-25 04:00:00 <= rental_date <= 2005-05-25 05:00:00"
                      ] /* ranges */
                    } /* range_access_plan */,
                    "rows_for_plan": 10,
                    "cost_for_plan": 3.0254,
                    "chosen": true
                  } /* chosen_range_access_summary */
                } /* range_analysis */
              }
            ] /* rows_estimation */
          },
          {
            "considered_execution_plans": [
              {
                "plan_prefix": [
                ] /* plan_prefix */,
                "table": "`rental`",
                "best_access_path": {
                  "considered_access_paths": [
                    {
                      "access_type": "ref",
                      "index": "idx_fk_inventory_id",
                      "rows": 5,
                      "cost": 6,
                      "chosen": true
                    },
                    {
                      "access_type": "range",
                      "rows": 5,
                      "cost": 5.0254,
                      "chosen": true
                    }
                  ] /* considered_access_paths */
                } /* best_access_path */,
                "cost_for_plan": 5.0254,
                "rows_for_plan": 5,
                "chosen": true
              }
            ] /* considered_execution_plans */
          },
          {
            "attaching_conditions_to_tables": {
              "original_condition": "((`rental`.`inventory_id` = 4466) and (`rental`.`rental_date` >= '2005-05-25 04:00:00') and (`rental`.`rental_date` <= '2005-05-25 05:00:00'))",
              "attached_conditions_computation": [
              ] /* attached_conditions_computation */,
              "attached_conditions_summary": [
                {
                  "table": "`rental`",
                  "attached": "((`rental`.`inventory_id` = 4466) and (`rental`.`rental_date` >= '2005-05-25 04:00:00') and (`rental`.`rental_date` <= '2005-05-25 05:00:00'))"
                }
              ] /* attached_conditions_summary */
            } /* attaching_conditions_to_tables */
          },
          {
            "refine_plan": [
              {
                "table": "`rental`",
                "access_type": "range"
              }
            ] /* refine_plan */
          }
        ] /* steps */
      } /* join_optimization */
    },
    {
      "join_execution": {
        "select#": 1,
        "steps": [
        ] /* steps */
      } /* join_execution */
    }
  ] /* steps */
}
MISSING_BYTES_BEYOND_MAX_MEM_SIZE: 0
          INSUFFICIENT_PRIVILEGES: 0
1 row in set (0.00 sec)
这里缺一段讲解,稍后补上
6 确定问题并采取相应的优化措施
经过以上操作,基本可以定位问题出现的原因。此时可以根据实际情况采取相应措施,通过优化来提高执行的效率。比如在第三点提到的低效sql的执行计划,已经确认是对客户表customer的权标扫描导致效率不理想,我们可以通过对email创建索引来提高效率。
 mysql> create index idx_email on customer(email);
Query OK, 0 rows affected, 1 warning (0.05 sec)
Records: 0  Duplicates: 0  Warnings: 1

mysql> explain select sum(amount) from customer a ,payment b where 1=1 and a.customer_id=b.customer_id and email ='[email protected]'\G
*************************** 1. row ***************************
           id: 1
  select_type: SIMPLE
        table: a
         type: const
possible_keys: PRIMARY,uk_email,idex_email,idx_email
          key: uk_email
      key_len: 153
          ref: const
         rows: 1
        Extra: Using index
*************************** 2. row ***************************
           id: 1
  select_type: SIMPLE
        table: b
         type: ref
possible_keys: idx_fk_customer_id
          key: idx_fk_customer_id
      key_len: 2
          ref: const
         rows: 28
        Extra: NULL
2 rows in set (0.00 sec)
对比第3点,可以看出建立索引对customer表需要扫描的行数rows变少,性能有所提升(根据类型判断性能:由all变为const),可见索引的使用可以大大提高数据库的访问速度,尤其表越大效率越明显。