ndarray运算
逻辑运算
# 重新生成8只股票10个交易日的涨跌幅数据
stock_change = np.random.normal(0, 1, (8, 10))
stock_change

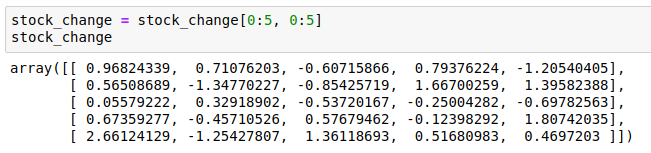
stock_change = stock_change[0:5, 0:5]
stock_change
# 逻辑判断, 如果涨跌幅大于0.5就标记为True 否则为False
stock_change > 0.5

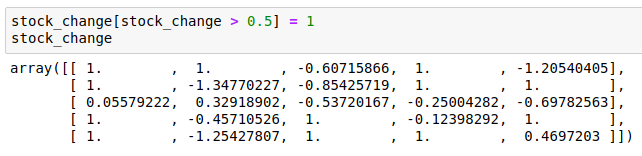
# BOOL赋值, 将满足条件的设置为指定的值-布尔索引
stock_change[stock_change > 0.5] = 1
通用判断函数
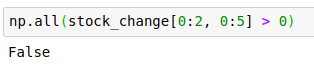
- np.all(),全部为真才是真
# 判断stock_change[0:2, 0:5]是否全是上涨的
np.all(stock_change[0:2, 0:5] > 0)
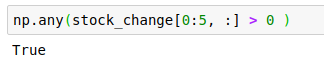
- np.any() 只要有真就是真
# 判断前5只股票这段期间是否有上涨的
np.any(stock_change[0:5, :] > 0 )
np.where(三元运算符)
通过使用np.where能够进行更加复杂的运算
- np.where()
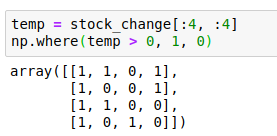
# 判断前四个股票前四天的涨跌幅 大于0的置为1,否则为0
temp = stock_change[:4, :4]
np.where(temp > 0, 1, 0)
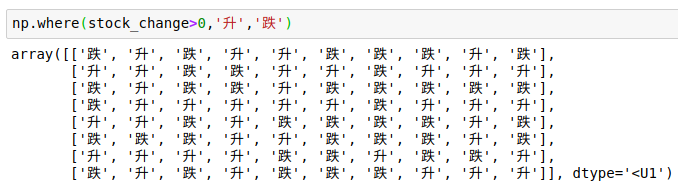
np.where(stock_change>0,'升','跌')

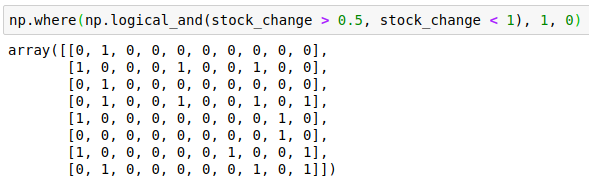
- 复合逻辑需要结合np.logical_and和np.logical_or使用
# 判断股票的涨跌幅 大于0.5并且小于1的,换为1,否则为0
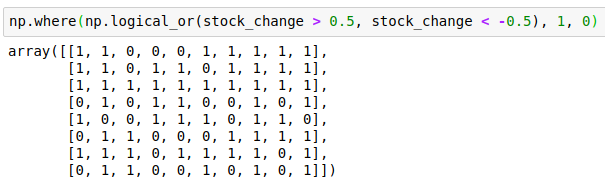
# 判断股票的涨跌幅 大于0.5或者小于-0.5的,换为1,否则为0
np.where(np.logical_and(stock_change > 0.5, stock_change < 1), 1, 0)
np.where(np.logical_or(stock_change > 0.5, stock_change < -0.5), 1, 0)
统计运算
如果想要知道涨幅或者跌幅最大的数据,应该怎么做?
统计指标
在数据挖掘/机器学习领域,统计指标的值也是我们分析问题的一种方式。常用的指标如下:
- min(a[, axis, out, keepdims])最小
Return the minimum of an array or minimum along an axis. - max(a[, axis, out, keepdims])最大
Return the maximum of an array or maximum along an axis. - median(a[, axis, out, overwrite_input, keepdims])取中值
Compute the median along the specified axis. - mean(a[, axis, dtype, out, keepdims])平均值
Compute the arithmetic mean along the specified axis. - std(a[, axis, dtype, out, ddof, keepdims])标准差
Compute the standard deviation along the specified axis. - var(a[, axis, dtype, out, ddof, keepdims])方差
Compute the variance along the specified axis.
进行统计的时候,axis 轴的取值并不一定,Numpy中不同的API轴的值都不一样,在这里,axis 0代表列, axis 1代表行去进行统计

股票涨跌幅统计运算
# 接下来对于这4只股票的4天数据,进行一些统计运算
# 指定行 去统计
print("前四只股票前四天的最大涨幅{}".format(np.max(temp, axis=1)))

# 使用min, std, mean
print("前四只股票前四天的最大跌幅{}".format(np.min(temp, axis=1)))
print("前四只股票前四天的波动程度{}".format(np.std(temp, axis=1)))
print("前四只股票前四天的平均涨跌幅{}".format(np.mean(temp, axis=1)))

如果需要统计出哪一只股票在某个交易日的涨幅最大或者最小?
- np.argmax(temp, axis=)
- np.argmin(temp, axis=)
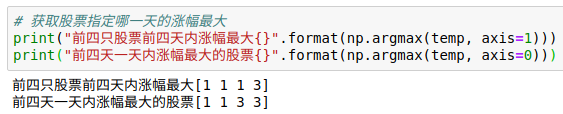
# 获取股票指定哪一天的涨幅最大
print("前四只股票前四天内涨幅最大{}".format(np.argmax(temp, axis=1)))
print("前四天一天内涨幅最大的股票{}".format(np.argmax(temp, axis=0)))
另外:
