如果您是想要以编程方式创建托管图表的开发人员,那么Highcharts Cloud API可能适合您。
虽然您可能会认为Highcharts Cloud是一个用户友好的前端,用于创建,存储和发布图表,但还有更多功能。Cloud API提供了一种以编程方式创建和修改托管在云中的图表的方法。您可以使用Cloud UI执行任何操作,也可以使用API。您可以考虑这种方法的原因有很多:
您可以处理来自任何应用程序的数据,并在Highcharts Cloud中生成图表。
以编程方式生成的图表成为图表库的一部分,可供所选用户组访问,或在Web上公开访问。
图表可供人工编辑进一步自定义。
您可以通过API管理团队,成员及其编辑访问和编辑权限。
已发布的图表可立即使用,并通过高可用性CDN提供。
您无需任何额外工作即可获得图表的使用情况统计信息
您还可以管理团队权限和角色。
在本教程中,我将向您展示如何构建从数据库读取数据的Web应用程序,并使用Highcharts Cloud API创建,复制和删除图表。我将使用以下技术Nodejs,expressJS,MongoDB和jQuery。Javascript,Node.js和MongoDB的基本知识有助于更好地理解应用程序代码。
您可以从以下GitHub链接下载本文中使用的代码。
最终的应用程序如下所示:
在进一步讨论之前,请确保您拥有具有API访问权限的Highcharts Cloud计划(Enterprise或Team Advanced)。
我将首先介绍一下架构和一些代码; 然后我将向您展示如何获取和运行该应用程序。
架构
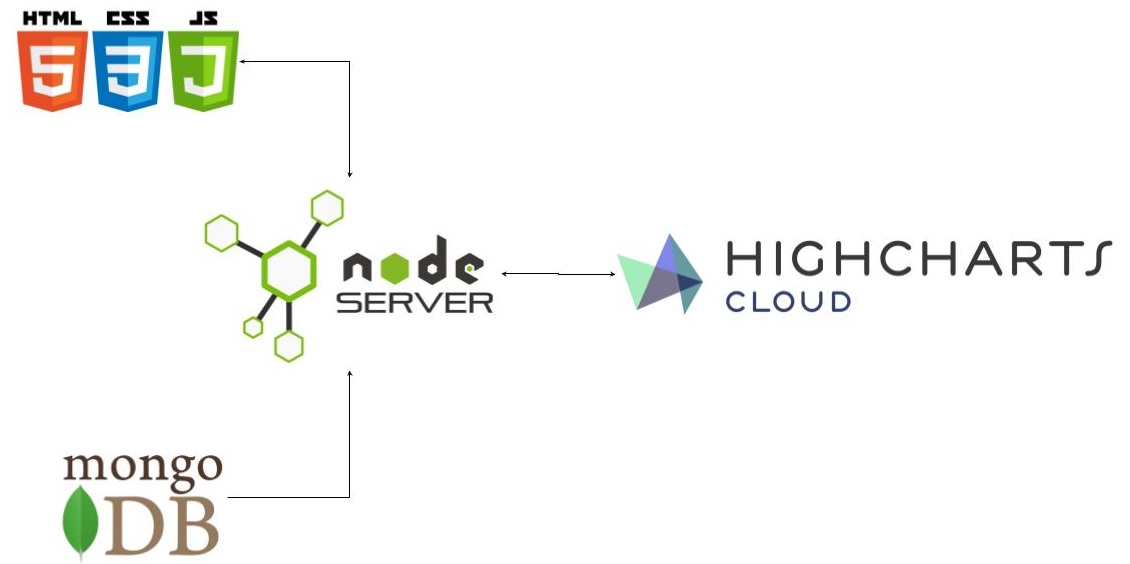
主要思想是创建一个RESTful应用程序,该应用程序公开一个简单的API,允许用户根据从MongoDB获取的数据集创建Highcharts Cloud图表。
.jpg)
下面的应用程序流程图显示了如何处理两个不同的请求:读取数据和创建图表。复制和删除图表与创建图表具有相同的代码结构。
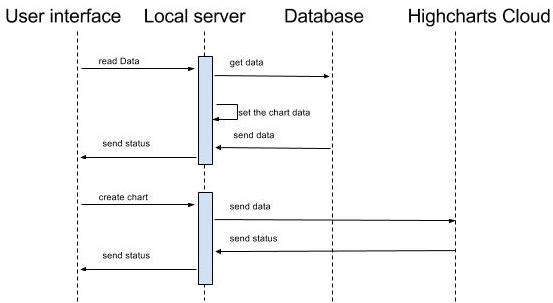
让我们来看看架构的每个元素。
数据库
我使用MongoDB数据库来存储图表的信息,例如标题和系列数据。MongoDB在构建JavaScript应用程序时很容易使用,因为它本身存储JSON。这意味着查询结果表示为正确的JavaScript对象,这使得事情更加整洁。
以下是数据库中保存的数据结构:
{
    "data": [
        43934,
        52503,
        57177,
        69658,
        97031,
        119931,
        137133,
        154175,
        354175
    ],
    "title": "New Solar installation in 2030"
}
我使用mLab(在线服务)来管理我的数据库。mLab提供免费计划,足以满足此应用需求。任何其他服务或本地MongoDB实例也将起作用。
用户界面
客户端页面具有以下功能:
从数据库中读取数据。
创建图表。
复制图表。
删除图表。
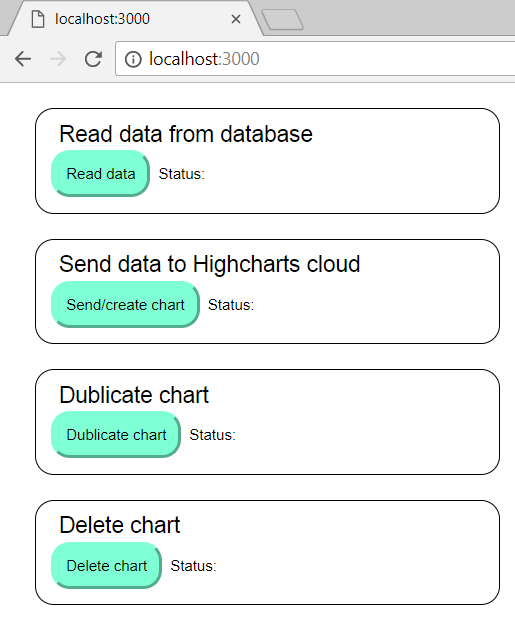
HTML(index.html)和CSS(style.css)文件用于构建用户界面; javascript文件(app.js)负责执行请求。如果您已经从GitHub下载了代码,则可以在公共文件夹中找到这些文件:
.png)
我使用jQuery来监听按钮点击,以及执行对服务器的Ajax请求。任何其他库或框架也可以正常工作,您需要做的就是绑定到click事件,并执行Ajax请求。您还可以使用XMLHttpRequest和getElementByID来使用vanilla JavaScript。
所有四个按钮都具有相同的代码结构。 以下是发送readDataFromDB命令的代码:
 //Read data from DB to the myServer
  $("#readDataFromDB").click(function() {
    $.ajax({
      type: "GET",
      url: "http://localhost:3000/readDataFromDB",

      dataType: 'json',
      contentType: 'application/json',
      success: function(res) {
        //Show status
        console.log(res);
        showStatus(res.status, '#readDataFromDBLabel');
      },
      error: function() {
        //Show status
        console.log(res);
        showStatus(res.status, '#readDataFromDBLabel');
      }
    });
  });
此代码将处理程序绑定到readDataFromDB 按钮的click事件。处理程序对RESTful服务器上的/ readDataFromDB路由执行Ajax请求。请求完成后,我会更改按钮旁边状态标签的标题,以反映使用showStatus(status,target)函数发生的情况。
请注意,我将dataType设置为json。这是因为我们的RESTFul服务器使用JSON格式的数据进行响应。它还告诉jQuery自动将返回的数据转换为实际的JavaScript对象。状态作为第一个参数传递给要发布的函数showSatus(); 标签用作第二个参数,在本例中使用ID readDataFromDBLabel。
function showStatus(result, label) {
  $(label).text("Status: " + result);
};
以下是包含所有请求的其余用户界面代码:
document.addEventListener('DOMContentLoaded', function() {

  //Read data from DB to the myServer
  $("#readDataFromDB").click(function() {
    $.ajax({
      type: "GET",
      url: "http://localhost:3000/readDataFromDB",

      dataType: 'json',
      contentType: 'application/json',
      success: function(res) {
        //Show status
        console.log(res);
        showStatus(res.status, '#readDataFromDBLabel');
      },
      error: function() {
        //Show status
        console.log(res);
        showStatus(res.status, '#readDataFromDBLabel');
      }
    });

  });


  //Create chart
  $("#sendToHCCloud").click(function() {

    $.ajax({
      type: "GET",
      url: "http://localhost:3000/sendToHCCloud",

      dataType: 'json',
      contentType: 'application/json',
      success: function(res) {
        //Show status
        console.log(res);
        showStatus(res.status, '#sendToHCCloudLabel');
      },
      error: function() {
        //Show status
        console.log(res);
        showStatus(res.status, '#sendToHCCloudLabel');
      }
    });

  });

  //duplicate chart
  $("#duplicateChart").click(function() {

    $.ajax({
      type: "GET",
      url: "http://localhost:3000/duplicateChart",

      dataType: 'json',
      contentType: 'application/json',
      success: function(res) {
        //Show status
        console.log(res);
        showStatus(res.status, '#duplicateChartLabel');
      },
      error: function() {
        //Show status
        console.log(res);
        showStatus(res.status, '#duplicateChartLabel');
      }
    });

  });

  //Delete the chart
  $("#deleteChart").click(function() {
    $.ajax({
      type: "GET",
      url: "http://localhost:3000/deleteChart",

      dataType: 'json',
      contentType: 'application/json',
      success: function(res) {
        //Show status
        console.log(res);
        showStatus(res.status, '#deleteChartLabel');
      },
      error: function() {
        //Show status
        console.log(res);
        showStatus(res.status, '#deleteChartLabel');
      }
    });

  });

}, false);